Last week the mantra was up and then a push back but constantly on the watch for the market direction to change to up. Market direction dipped slightly last week but the outlook was for it to be short and shallow so today’s move higher is not only expected but probably moved higher then expected because of investor optimism on the fiscal cliff issue. Meanwhile I heard a number of Congressmen over the weekend reflecting that they could not see how any deal could be done by Christmas but as always there is a lot of politics involved and we are not privy to the constant wranglings in this budget battle.
Market Direction For Dec 17 2012
The S&P 500 closed at 1430.36, up 16.78 points or 1.2 percent, finishing the day close to a two-month high while the Dow closed at 13235.39, up 100.38 points or 0.8 percent. In Canada our TSX was down slightly at a loss of about 15 points.
Fiscal Cliff Issue
House Speaker Boehner now seems willing to allow tax increases on those earning more than 1 million. The President indicated he wants taxes higher on people earning less than a million dollars but a lot of investors took Boehner’s stance as a softening of the Republican position.
Economics
Meanwhile New York manufacturing activity was lower than expected but housing stocks had some nice gains including DR Horton which was up 5.1 percent.
Apple Stock And Market Direction
Apple Stock continues to worry analysts and many investors. More and more technical analysts are convinced that the decline in Apple Stock is a definitive signal of a market direction downturn for stocks. But while Apple Stock turned lower early in the day following target price cuts by Citigroup and Canaccord, Apple Stock managed to close up 1.8 percent to $518.83.
Canadian Stock – Sun Life (SLF)
In Canada one of the biggest loser was Sun Life Stock (Symbol SLF) which pulled back 3.9% after it announced its intent to sell its US annuity business to Delaware Life Holdings for 1.35 billion. Investors were unsure what to make of the sale as it means less risk for Sun Life Stock but could also impact future earnings. Personally I think Sun Life stock is ahead of itself above $27 and it was very overbought.
Santa Claus Rally and Market Direction
A lot of times it is investors who through their enthusiasm manage to actually move the market direction higher and I do believe the anticipation by investors of a Santa Claus rally which is normal for the end of December, helped push the market direction higher today. Let’s look at the market direction technical analysis.
Market Direction Technical Analysis of Dec 17 2012
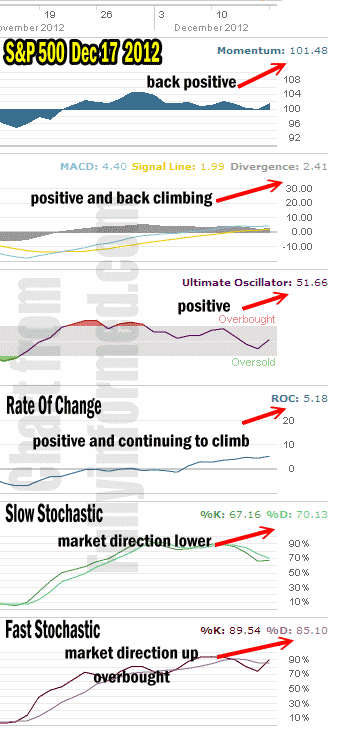
All the indicators are back climbing and showing there is strength behind this move higher. Let’s look at the individual market direction technical indicators.

Market Direction Technical Indicators for Dec 17 2012
For Momentum I am using the 10 period. Momentum is once more positive and climbing.
For MACD Histogram I am using the Fast Points set at 13, Slow Points at 26 and Smoothing at 9. MACD (Moving Averages Convergence / Divergence) is which gave a signal up on November 23 2012 did not turn negative over the past several weeks. It had begun a gradual decline last week, but failed to signal market direction down. Today it is higher than Friday and back climbing.
The Ultimate Oscillator settings are Period 1 is 5, Period 2 is 10, Period 3 is 15, Factor 1 is 4, Factor 2 is 2 and Factor 3 is 1. These are not the default settings but are the settings I use with the S&P 500 chart set for 1 to 3 months.
The Ultimate Oscillator is now positive again and it too is climbing.
Rate Of Change is set for a 21 period. When I changed the Rate Of Change indicator from 10 to 21 it was to give this timing indicator a longer range to reflect on, to provide a longer signal. Throughout the latest period of weakness, the Rate Of Change indicator remained solidly bullish with just a slight pullback late last week. Today Rate Of Change is signaling that the market direction remains higher.
For the Slow Stochastic I use the K period of 14 and D period of 3. The Slow Stochastic is no longer overbought and since it looks out more than a day or two it is signaling that despite today’s move higher, the market direction will not be all that much higher than it is today. In other words, the market direction is pushing into heavier resistance and may end up lower or not a lot higher a few days out. The technical indicators cannot judge emotion behind something like the Santa Claus rally that so many investors are hoping for. It will be interesting to view this indicator tomorrow and see what it shows us.
For the Fast Stochastic I use the K period of 20 and D period of 5. These are not default settings but settings I set for the 1 to 3 month S&P 500 chart when it is set for daily. The Fast Stochastic is also still overbought and signaling market direction is up but today’s move higher is showing that the market direction while up will not have big jumps higher from here over the next day or two without a catalyst of some sort. A positive announcement on the fiscal cliff will definitely be a catalyst which combined with investors seeking the Santa Claus rally could move the market to try to challenge the high for this year.
Technical Analysis and Market Direction
Most investors do not believe technical analysis and I certainly understand their views. This year I have written 246 market timing analysis posts for the daily movements of the S&P 500. Of those analysis, 79% have been correct in their outlook, and of the remaining 21%, 80% were accurate enough for me to trade against. The remaining handful was incorrect in what the next day would bring but within a day or two the technicals were once again correct for trading profitably against.
The majority of investors fail at technical analysis because they do not use it daily, do not understand how the technical indicator works and fail to understand what it is advising. Most investors feel that technical analysis should be bullet proof on the day they want to use it. Technical analysis does not work this way. It is a process of daily review, interpretation and then application whether the signal is up or down to trade profitably. With 2012 drawing to a close I look forward to 2013 to see if the same level of accuracy continues as I believe 2013 may prove to be a more difficult year for stocks and the markets in general.
Market Direction Outlook For Dec 18 2012 And Strategies In Use
The market direction outlook Dec 18 is for the market to push higher. Investors are seeking the annual Santa Claus rally and they may push hard to make it self-fulfilling. The warning that the market direction is down, brought about by the decline of Apple Stock that so many analysts see, I am not convinced at this point in this rally. I have mentioned before that many analysts pushed Apple Stock higher earlier this year drawing more and more investors into the stock in the belief that the stock would easily move beyond $1000 within months and could close the year at $1500. My beliefe is that Apple Stock was pushed too high and is coming back to a normal range. In the end it is earnings that drive any stock and until those earnings increase Apple Stock may stay in a lower range. Apple itself has a mountain of cash and enormous potential but whether that can translate into even stronger earnings I have no way of knowing. Likewise whether the decline of Apple Stock is warning through its “death cross” that the entire stock market rally will collapse, I don’t have a clue. It’s rare when one stock ends a market direction rally such as we have seen all year. Indeed it was more than Apple Stock that led this market from the carnage of the bear market of 2008 to 2009.
Most bear markets require the financial sector to lead a recovery, but the last bear market was a financial crisis so it was impossible for the recovery to be led by that sector. Perhaps now the next leg up in this bull market will be taken over by the financial sector.
XLF ETF Financial Sector
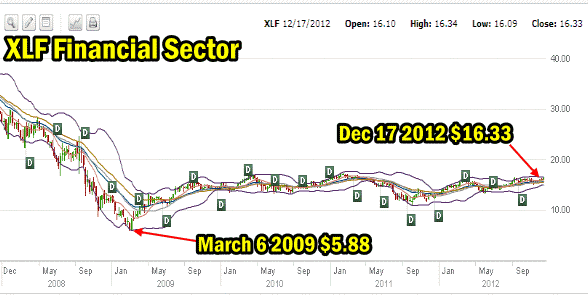
Looking at the 5 year chart of the financial sector as represented by the XLF ETF shows how anemic the recovery in the financial services has been. While it seems exciting to contemplate that perhaps the financial services sector is finally going to pick up some steam here, the 5 year chart doesn’t make a very convincing case.
However from a Put Selling perspective the XLF has been wonderful since October 2008 for profit-making. Put Selling has been easy on the XLF as this ETF has been stuck in a range since the market crash.

5 Year Chart XLF Financial ETF
The type of technical indicators I use are set for short-term trading and not for longer-term outlooks. For that I rely on the age-old method of the 50, 100 and 200 day moving averages.
Perhaps if the financial sector does not lead and technology is in the doldrums then maybe the decline of Apple Stock is indeed going to signal a definitive change in overall market direction. My technical indicators cannot judge that so I have to go on instinct and 4 decades of investing. I doubt one stock will break this market, but looking at the technology sector it isn’t just one stock, it is a lot of technology stocks that have had a very nice run-up, so just to waffle a bit more, I really have not a clue whether we are on the verge of seeing a significant decline in January of next year. But then that’s why I use my market direction technical indicators and my many stock and option strategies. They allow me to remain aware of short-term market direction but continue to profit from any market direction, up or down.
Final word then is Market Direction for tomorrow should see the market direction try to push higher.
Internal Market Direction Links
