Market Direction followed my outlook for today and moved lower. The market direction downturn today ended the S&P 500 six-day streak. The fiscal cliff again dominated along with retails sales report that didn’t meet analyst expectations. I look upon this market direction downturn though as an opportunity. While there appears to be little progress on the US budget talks, the S&P slumped 9.03 points of 0.6 percent and the Dow was down 74.73 points or again 0.6 percent. The NASDAQ was down 21.65 points for a loss of 0.72 percent. Apple stock continues to weigh on the NASDAQ as it fell 1.73% to to $529.69. There is lots of opportunity for profit in Apple Stock. Over the past few days I have received emails from investors who are using the Moving Averages Trading Strategy which I had featured last month.
With the weekly initial jobless claims down another 29,000 this supports the market timing system I wrote about a few weeks ago. Basically when the unemployment numbers are decreasing this is bullish for stocks. This market timing system has a very good track record.
Market Direction and Gold
Gold is back down to below $1700 again with a pull back of $21.10. Crude oil is down to $85.59 a barrel. For gold bugs I hope they are busy trading the swings in gold because otherwise gold has been stuck in a range for a long time and the only investors I know in gold are trading the swings as they wait for gold to move to that magically $2500 or even $3000. I don’t have a clue where gold is heading but I do know that by the time it gets there I will have made a lot more by trading stocks than by holding gold and hoping it climbs. Meanwhile gold commodity producers have had a rough time of it and Barrick Gold Corp fell again today by 2 percent.
For much of last week my market timing indicators had been signaling a market direction bounce in the works as the stock markets were extremely oversold, but without a catalyst there was no way for the market direction to stop falling. On Friday the comments from members of the House of Representatives after meeting with the President regarding the fiscal cliff and the importance of finding a compromise is all it took to stop the selling.
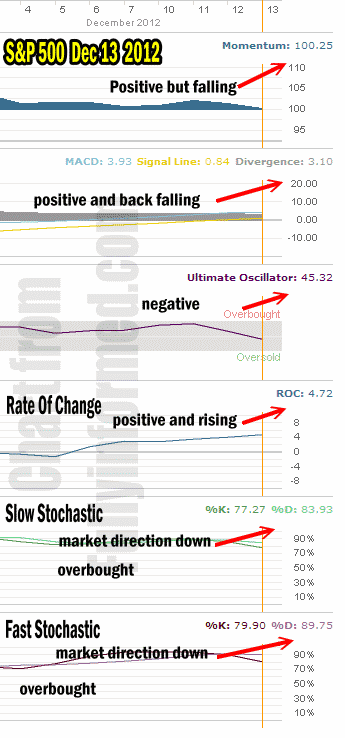
Market Direction Technical Indicators for Dec 13 2012
Let look at what the technical indicators had to say about market direction at the close of the markets today.
For Momentum I am using the 10 period. Momentum is still positive but is ready to fall to negative.
For MACD Histogram I am using the Fast Points set at 13, Slow Points at 26 and Smoothing at 9. MACD (Moving Averages Convergence / Divergence) is still positive although it is lower today than yesterday.
The Ultimate Oscillator settings are Period 1 is 5, Period 2 is 10, Period 3 is 15, Factor 1 is 4, Factor 2 is 2 and Factor 3 is 1. These are not the default settings but are the settings I use with the S&P 500 chart set for 1 to 3 months.
The Ultimate Oscillator is now negative.
Rate Of Change is set for a 21 period. Rate Of Change is still climbing showing there are still buyers in this market picking up stocks.
For the Slow Stochastic I use the K period of 14 and D period of 3. The Slow Stochastic is overbought and signaling that the market direction is still down.
For the Fast Stochastic I use the K period of 20 and D period of 5. These are not default settings but settings I set for the 1 to 3 month S&P 500 chart when it is set for daily. The Fast Stochastic is also overbought and is also confirming the market direction is down.

market direction technical analysis Dec 13 2012
Market Direction Outlook And Strategy
The market direction outlook for tomorrow is for stocks to continue to be under pressure. After the recent breakout and the overbought condition it is not unusual for the market direction to remain under pressure for a few days. Today though I noted how each push lower was met with buyers who obviously believe the mid-term direction will be higher shortly.
With the week before Christmas now almost upon us and then Christmas itself, I believe there will be a rally higher and I am using this dip to look for put selling opportunities.
New FullyInformed Members Category
A new addition to the members section of my website is a new category I am calling Trade Ideas, to show the stocks and ETFs that I am considering after the market closes. Each day when the market closes I run through the charts of various stocks and ETFs to determine if any have potential for possible trades in the next day or two. I look for everything from put selling, covered calls, and Bollinger Bands Strategy Trade to spreads and even leap opportunities. I started this category this evening and members each night can swing by and check out the stocks I am checking out for possible trades in the upcoming day. I thought this would be a good addition to assist investors in understanding the stock selection process I do each evening after the market closes.
Market Direction Outlook For Dec 14 2012
Market Direction for tomorrow then is for stocks to remain under pressure but again I am approaching this weakness as an opportunity and I do believe this weakness will be short-lived.
Internal Market Direction Links
