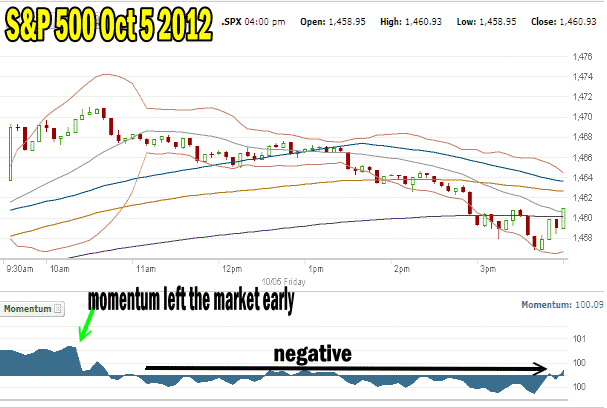
Friday was a bit disappointing for market direction higher. The employment numbers pushed the market at the open and the S&P and Dow set new highs once again. But within an hour optimism disappeared from the market and a pullback commenced. I have included the 5 minute market direction chart for Oct 5 below. I have also included momentum which is often a great technical indicator to use for daily study of the indexes. In the chart below, the momentum technical indicator is set for a period of 10. This gives a fairly good idea as to the overall momentum for the day. After the first hour momentum turned down and by 11:00 AM momentum had turned negative. It stayed negative for the rest of the day.

The S&P 500 for October 5 2012
Market Direction – Candlestick Chart Analysis
The candlestick at the close of Friday is called a high wave bearish harami. This candlestick marks indecision among investors. At the close on Friday Candlestick Chart Analysis was on the verge of a sell signal for the S&P 500. To study further let’s have a look at the market timing technical indicators at the close of trading.
Market Timing Technical Indicators
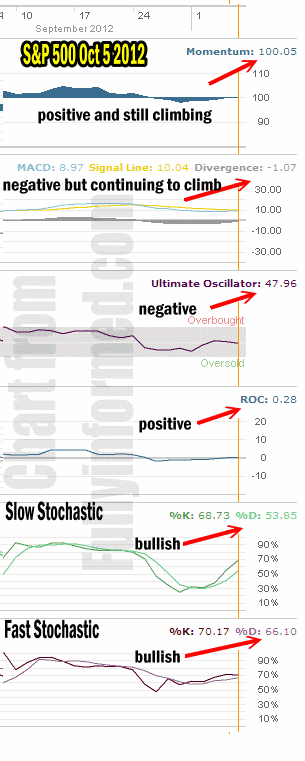
To get a better idea as to where the market direction may be for the start of the second week of October 2012, let’s look at the market timing technical indicators as of the close on Friday.
Momentum is now positive despite the selling for most of the day.
The MACD Histogram is still negative but even with the selling on Friday it is continuing to climb.
The Ultimate Oscillator has turned positive on Wednesday but was negative on Thursday and is lower again on Friday.
Interestingly rate of change is positive on Friday.
The Slow Stochastic on Friday was mildly bullish. This mildly bullish outlook was also confirmed by the fast stochastic which is also mildly bullish.

Market timing technical indicators for Market Direction are mildly bullish.
The general consensus on Friday is for the market direction to continue higher. The Market Timing technical indicators on Friday do not confirm the market moving lower. The consensus among the indicators is that Friday was nothing to be concerned about and the market should continue is climb higher. The fast stochastic is pointing to a higher Monday or Tuesday and the slow stochastic a higher market direction by mid-week.
Market Direction Outlook to Start the Week of Oct 5 2012
As long as market direction continues to hold I will be Put Selling on dips and holding off on covered calls unless like my BMO Stock trade I want to be exercised out of the stock.
A new feature starting with market direction is a market direction portfolio showing the trades down by a fellow investor, William who has graciously agreed to assist me and show his trades. William, only trades the indexes up or down as the market direction dictates. These market direction trades will not be in my portfolio as they are not my trades. William’s trades will be in the members section of my website which you can reach through this link.
