Market Direction heading into the second week of September may continue to see volatility although you would not guess it looking at the VIX Index index. On Friday the VIX Index index fell back to 14.38 near the lows of the year. As a measuring stick the VIX Index at this level would seem to indicate very little concern on the part of investors. Does this mean that most investors feel that more liquidity on the part of the ECB and the Federal Reserve is a done deal? If so then obviously investors must believe that more liquidity will push the market direction higher. I hear little concern about earnings supporting a market direction move higher which is my concern for any lasting move higher in the S&P 500.
US Dollar Chart & Gold
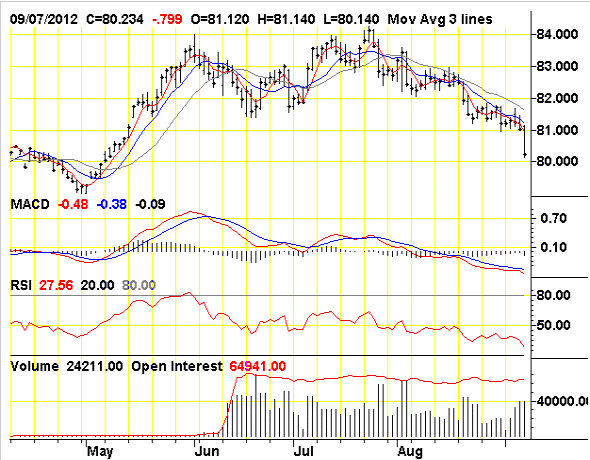
The US dollar chart shows that the US Dollar is back declining for much of August and this week saw quite the tumble in the dollar as it is on the verge of 4 month lows.

The US Dollar chart shows the decline in the dollar this week which co-relates to a rise in stock market direction
The decline in the dollar definitely helped to support the market direction moving higher but more important for a lot of investors, it also pushed up the value of precious metals, Gold and Silver. I am not a precious metals trader but I do know that a decline in the US dollar will mean higher prices for these commodities. However many analysts are calling for Gold to reach $3000 by year end on the flood of liquidity which they expect. I am definitely not of this opinion. The ECB has shown that it is more talk than action. Buying one to three-year bonds from the troubled Euro members in my opinion will not be inflationary. I also do not see the Federal Reserve stoking hyper-inflation with their bond buying program either. Inflation is really arriving more with weather /crop issues and transportation costs. While certainly low inflation is a desired consequence for any developed nation, the hyper-inflation pundits are now back in the media once again.
ABX Stock Added To My Portfolio
Instead I believe Gold and Silver appear stuck in a trading range. To this end I added Barrick Gold Corp, symbol ABX to my portfolio. This trade is using my Shark Options Trading strategy. I will be posting those trades shortly.You can read more about the Shark Options Trading Strategy here. I am using this strategy because it does not rely on news or events but instead looks at the price action of the underlying security to determine periods to buy and sell calls or puts. I have worked with ABX stock before using the Shark strategy and I believe the possibility of decent returns exists still within ABX stock. The other factor I enjoy with the Shark Strategy is that it requires very little capital as the focus is on options only. In the article I have for sale in my store there are three examples of the Shark Strategy in use. I show AGQ Proshares Ultra Silver (AGQ), Amazon Stock (AMZN) and Bank of Nova Scotia Stock (BNS). I am not interested in owning shares of ABX Stock at all which is why I am using the Shark Options Trading Strategy.
Market Timing Indicators To Start The Week

Market Direction could stall here.
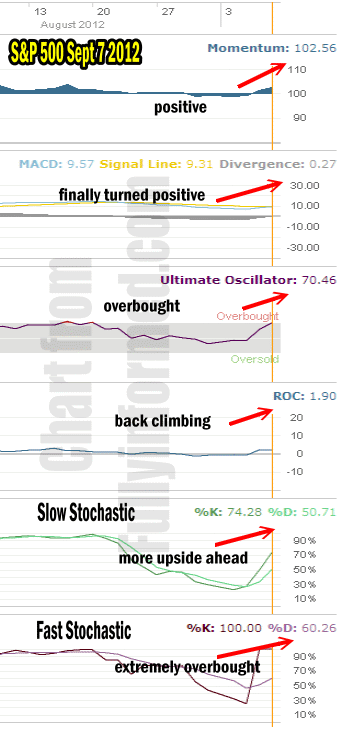
Market timing indicators on Friday are all positive but two indicators show the market direction as overbought.
Momentum is positive although it took Thursday and Friday to push momentum back to positive reflecting the market direction move higher.
MACD histogram surprising is finally positive on Friday. From Monday to Thursday last week MACD was negative. It has been negative since August 23 ignoring the climb in market direction and ignoring Thursday’s big jump higher in market direction. Friday marked the first positive day in several weeks.
The Ultimate Oscillator is signaling that the market direction is overbought to the upside. This does not mean the market direction might turn down or stall here, but it could definitely be facing heavy resistance going forward.
Rate Of Change is still positive which considering Thursday’s market direction big bounce is not surprising.
Slow Stochastic which looks out beyond one or two days shows that there is room for the market direction to push higher.
The Fast Stochastic on the other hand has a %K reading of 100 which is extremely overbought. But with a %D reading of 60, there is little chance of a severe pullback in market direction any time at the start of the week. We could therefore see stock market direction move sideways for a couple of days.
Candlestick Chart Analysis
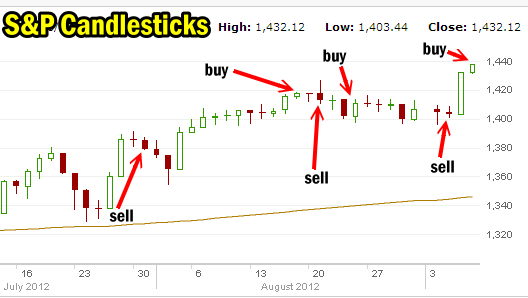
For those investors who like to follow candlestick chart analysis, it has been tough since July 31 for candlestick chart analysis to get a clear market direction trend. On July 31 candlestick chart analysis gave a sell signal. Then on August 17 a buy signal. Then candlestick chart analysis gave a sell signal on August 21 and then a buy signal on August 24. On September 5 candlestick chart analysis gave a sell signal again and then on Friday Sept 7 a buy signal. The candlestick chart analysis chart below shows the difficult time this timing indicator is having trying to pinpoint market direction.

Since July 31 candlestick chart analysis has had a hard time with market direction
The flip-flop back and forth is understandable as the candlestick chart analysis is looking for a clear direction from investors and for much of August there was none.
Market Direction Summary Heading Into Week Two Of September
September is among the worst months for the stock markets in general with market direction almost always negative. It will be interesting to see how this September fares. With the stock market at new 52 week highs and an extremely oversold reading from fast stochastic, I intend to continue to sell puts on dips and keep cash at the ready for opportunities, but as far as a crash in market direction, I don’t see this in the cards at this time. Presently the market direction pullback from the April highs has been nothing more than a normal 10% bull market correction.
