Well the sideways action continues with Market Direction today. It really is more the market breadth that is continuing to point to upside in stocks. Each day it has set another new high even on low volume days. Meanwhile the Russell 2000 ETF is clearly showing the uptrend remains in place as each day it shows strength. Obviously the market direction uptrend remains consistent at this point.
Market Direction and Russell 2000
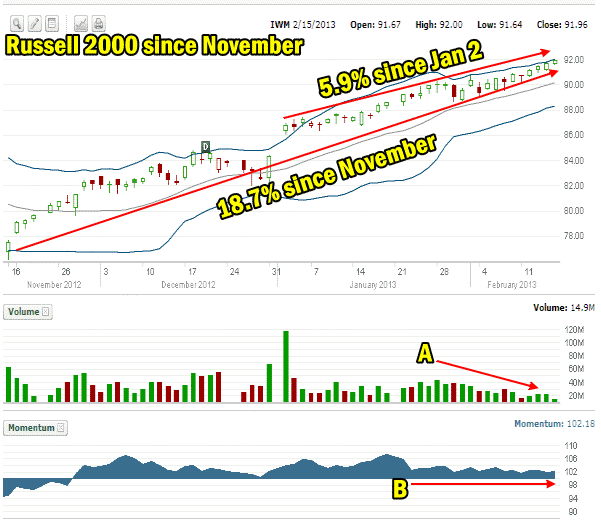
The Russell 2000 is clearly in an uptrend as seen in the market direction chart below. The Russell 2000 ETF follows the small cap stocks and shows that investors are busy buying and pushing small cap stocks higher. Since stocks bottomed November 16 2012, the Russell 2000 is up an incredible 18.7%. Since Jan 2 2013 the Russell 2000 is up 5.9%. The only concerns I have lately with the advance is the volume levels are declining (POINT A in the chart below). However Momentum (POINT B in the chart below) has been reasonable steady, only pulling back slightly the last few days. Momentum though remains strong.

Market Direction and Russell 2000 ETF since November 2012
The Russell 2000 is worth watching as it gives a lot of clues as to overall market direction for stocks in general.
Intraday Market Direction on the S&P 500
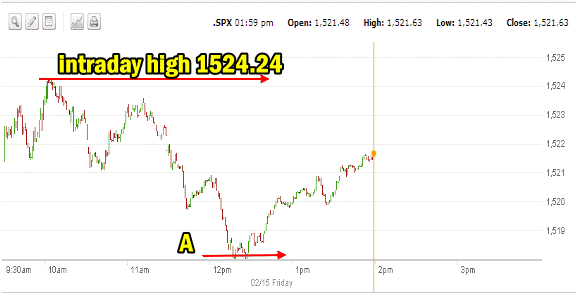
The intraday action on the S&P 500 is shown below in the 1 minute chart. This morning the market made a new intraday high of 1524.24. Then it fell to the lows at noon. The market direction is now trying to rally back. If the S&P fails to close on the intraday high, the technical indicators for the most part will remain fairly unchanged. The chop,chop, chop action of the market direction as it pushing sideways with a bias to the upside keeps sending warnings to the Market Direction technical indicators primarily because volume on the buying side just does not support clearer signals to the upside from the market direction technical indicators.

Market Direction on the S&P 500 intraday Feb 15 2013
Until this daily activity ends the market direction technical indicators will remain cautious of the market advance, which is normal. This is part of the reason the Russell 2000 ETF is important to keep an eye on. As long as it continues to climb the market direction up will remain intact. The choppiness is not going to go away any time soon by the look of the trading action going on.
The Empire State manufacturing index, showed that activity in the New York region rebounded to a reading of 10 from negative 7.8 last month which beat forecasts and signaled growth. The Thomson Reuters/University of Michigan consumer sentiment index for February issued a preliminary reading of 76.3 which was a three-month high.
Key commodities were weak. Gold fell to $1,611 (U.S.) an ounce, down nearly $25. Crude oil fell to $95.70 a barrel, down $1.61.
Market Direction and Gold
As readers know I am Put Selling Barrick Gold Stock, symbol is ABX. Overall I am unimpressed with the commodity itself. I believe with nations around the world printing currencies, the problems with North Korea and Iran as well as the stock piling of gold by various nations including Russia, Gold should be performing a lot better. It isn’t and I still see no reason to own this previous metal. I have made over 300 percent more through Put Selling ABX Stock than if I had bought gold 5 years ago. I see no reason to buy gold unless I felt an “end of days” kind of event was to unfold. Commodities like Gold, Silver and Copper are difficult to trade at the best of times. Right now I believe Gold is a poor way to invest. I remain bearish on owning gold, but I am certainly enjoying put premiums in ABX Stock.
Market Direction For The Remainder Of The Day
The Put Selling strategy continues for my portfolio. This morning I sold some Coca Cola Stock puts and I am back doing the Apple Stock bi-weekly Put Selling strategy. My naked puts for February options are expiring on all the stocks I have put sold against which shows that despite the choppiness of the markets, Put Selling is an excellent strategy to use in any market direction, up, sideways or down. I expressed my opinion that I see nothing short-term on the radar that will plunge stocks per the media pundits looking for a 1000 point drop by month’s end in the DOW. February remains a weak month but the market direction has continued to claw its way to the upside and sets new 5 year highs almost daily. The market direction shows all the signs of a classic bull market with naysayers everywhere. When those doomsayers begin to disappear I will be looking for market direction to start a pullback, but that could be weeks away still.
Internal Market Direction Links
Profiting From Understanding Market Direction (Articles Index)
Understanding Short-Term Signals
Market Direction Candlestick Daily View (Members only)
Market Direction Portfolio Ongoing Trades (Members only)
