Market Direction appears to baffle many analysts. They seem intent on trying to figure out in a rational manner, “why” the market direction is back up when economically the globe appears poised to fall off a financial cliff. I am not sure why any analyst would believe that stock markets behave rationally. That’s like telling investors to leave emotion completely out of trading. Instead consider that market direction is a roller coaster ride that roars up, plummets down and has lots of blood curdling twirls and hairpin turns. In a nutshell, market direction is always emotional and will react with every event and rumor. Rational and stocks are two words that don’t seem well related.
Instead of constantly trying to explain away in a rational manner why the stock market is “not” rational, analysts should be looking at ways to profit from the roller coast ride that stocks are always on. Since investing in the 1970’s I cannot recall a rational year within the stock markets. The trick is to forget about rationalizing stocks but instead devise strategies that profit consistently from the market direction trend.
Profiting From The Market Direction Trend
I am not sure who coined the phrase, “the trend is your friend”, but I would change it to “trend strategies are your friend”. It is not as catchy but it is true. By developing strategies, complex or simple, to benefit from the market direction trend, investors can forget about worrying about stock market direction and instead enjoy profiting from whatever direction the market is moving.
This correction has tired out many analysts and just when they thought they had the market direction pegged as down, the market on Friday came roaring back. But this is what creates volatility and volatility creates fat and juicy option premiums for Put Selling or dozens of other options trading strategies.
Market Timing Outlook To Start The Week
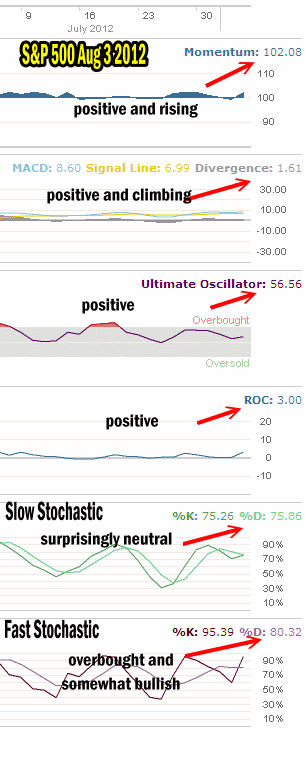
My market timing indicators are presenting an interesting outlook to start the week. Market timing indicators are overbought but moderately bullish.
Momentum is positive and rising as is the MACD Histogram.
The Ultimate Oscillator is up slightly from Thursday but not overly bullish which could signal some sideways movement in stocks for some of the week.
Rate of change is bullish and climbing which reflects Friday’s big push higher.
The Slow Stochastic however is surprisingly neutral and as it looks out more than a couple of days. It is telling me that the recent move up may not have much follow through this week.
The Fast Stochastic is showing a very overbought market but it is somewhat bullish which could mean some overbought selling as investors take profits and then perhaps a bit more upside, although the slow stochastic’s neutral reading has to be taken into account for later this week.

Market Direction Chart and Bollinger Bands
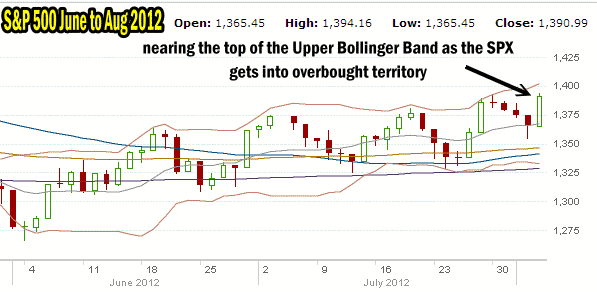
The Bollinger Bands setting I use is 12, 2 rather than 20,2. This gives me a bit tighter reading on the S&P 500. Market direction has been pushed back to the Upper Bollinger band which marks overbought for the market. There is a bit of room for the market direction to be pushed up but whether it can break the Upper Bollinger Band is hard to judge. However for my Put Selling strategies to work it really doesn’t matter if the S&P can break through the Upper Bollinger Band, but instead it is far more important for the pattern of Higher Highs and Higher Lows to remain in place.

The market direction is being pushed back to the Upper Bollinger Band which marks a move into overbought territory for the S&P
The pattern of higher highs and higher lows has been incredibly profitable, which you can see from this article.
Market Direction Outlook Summary
My prediction to start the week is investors may see some profit taking early in the week and then a sideways motion with a slight bias to the upside heading into the end of the week. The overbought condition needs to be worked out and profit taking should take care of this. As long as profit taking is not too severe, the market direction should try to then push back up and perhaps attempt a break of the Upper Bollinger Band around 1400 in the S&P. This should be an interesting week for market direction.
