Market Direction continues to rise despite the lack of volume and poor breadth in the stock market. One of the interesting aspects of this latest market rally is that the candlestick chart analysis of the NASDAQ, S&P 500 and Russell 2000 (IWM) has failed to give any buy signal despite the three days of rally. Today the Dow Jones Composite finally got a buy signal at the close from the candlestick chart analysis confirming market direction up trend. It took three days for the candlestick chart analysis to give a buy signal to one stock index. This reflects the poor volume in the latest rally. At the same time while market direction for three days has been solidly higher, the market stats are showing the majority of traders are short this latest rally. But are they right to be this cautious?
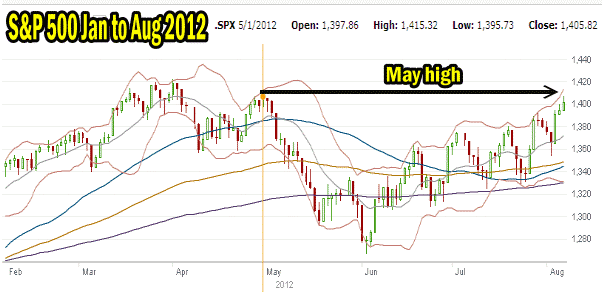
Market Direction Chart for Aug 7 2012
Today’s S&P market chart shows the market almost back to the May 1 2012 high. If the market direction can continue and breaks through the May 1 high, it will be within striking distance of the April all time high for this market. It is certainly doable and it will not need a lot of market volume to push that high. With so many traders short the market direction and many others not even in this market, the market direction can confound investors either way. As well, should the market direction continue to climb those investors short this market may begin to cover, which will push the market higher still.

The market direction chart from January to August 2012
Market Timing Technical Indicators
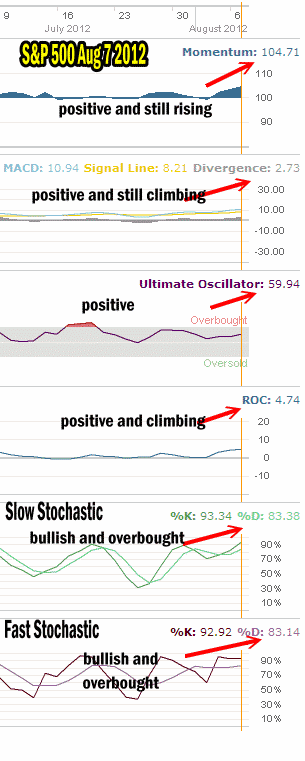
To understand more about market direction let’s review today’s market timing indicators at the close. Momentum is not only positive but still rising.
MACD histogram is positive and continues to climb.
The Ultimate Oscillator is not overbought and is moving more sideways than up reflecting the lack of volume in this rally.
Rate of change is up considerably over the last three trading sessions.
Finally we come to the last two market timing indicators. The Slow Stochastic on the weekend was somewhat neutral on the market direction for mid-week. It has moved into bullish but overbought. Fast Stochastic on the weekend was overbought but somewhat bullish. It is not as overbought as on Friday and still bullish.

Market timing indicators for Aug 7 2012 continue to confirm the market direction as up
Market Direction Outlook For Mid-Week
The market timing indicators remain bullish but show signs of being overbought. A market can remain overbought for an extended period of time. With volumes being light the market direction can flip-flop quicker than market timing Technicals can warn. For this reason it is important to watch for overbought conditions and monitor if they are increasing. For example, on Friday the Fast Stochastic reading was higher than today which indicates that the market direction could continue to climb higher before pulling back. Personally though experience tells me that a rally with light volume and poor breadth will only last a few days and this is the third up day.
I prefer selling puts because of times like this. The market direction is pushing higher but the rally has little conviction. Meanwhile a lot of traders are short the market direction up which can often push the market direction even higher if they start to cover their positions. At the same time if the market direction does start to pull back then buying stocks as the market was climbing was a mistakes. Put Selling makes it a lot easier to be wrong either up or down, and allows me to continue to profit with the market even if I am wrong with the overall market direction.
