Market Direction today took a bit of a tumble out of the gate. The stock markets fell quickly but when it appeared that the market was not going to enter a major selling frenzy it charged back throughout the day and closed near the day’s high. This often is a sign of strength and while I think everyone knows about the sell in May theory, this is an election year and election years often are different “animals” than your run of the mill S&P market.
Still the market direction drop this morning shows the uneasiness among investors both large and small. It’s important to keep this in the back of your mind when trading because it could take just one event to turn the bull market down. For now though my stock market timing indicators are actually buoyed by the day’s activity.
It is important to remember that the market was oversold the last few trading sessions and while the S&P 500 has not made a new 4 year high, the Dow has and today some of the selling had to be inspired by that brand new high. Traders love selling on new highs and this was a major accomplishment for the Dow.
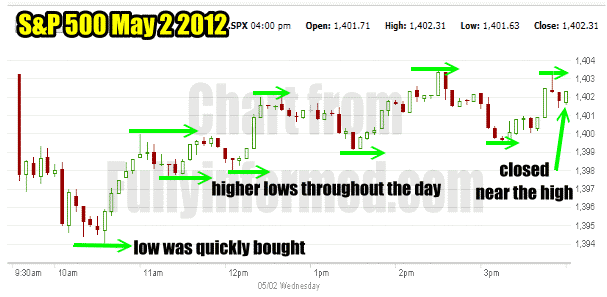
Market Direction Chart For May 2 2012
Below is today’s market direction activity. It’s actually an interesting chart today. It shows the strength in this market.The low by 10:30 was put in and it was quickly bought after the second large plunge. From there the market direction continued to make higher lows throughout the day. Look how every single pullback was higher than the previous one. For investors who buy and sell calls this was a classic day I am sure.

Market Direction turned higher by mid-morning and climbed throughout the day. This strength was confirmed by the market timing indicators.
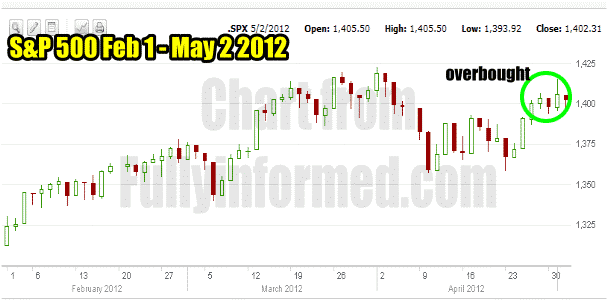
Stock Market Timing Chart For Feb 1 – May 2 2012
The past 3 months market direction are shown in the stock market timing chart below. Note how the market is already overbought (shown in green) even though it has not set a new high or reached the previous high. The S&P 500 is the only index that continues to have trouble. However as it represents a lot more companies than the Dow Jones I think it is understandable.

Stock Market Timing Chart for May 2 2012 Showing The Last 3 months of the S&P 500
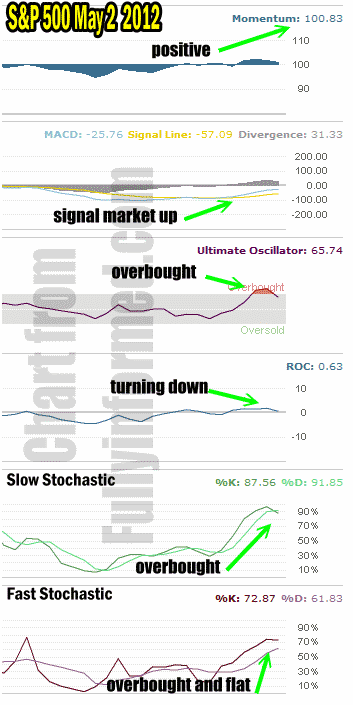
Stock Market Timing Indicators For May 2 2012
Below are my stock market timing indicators for today. The market direction uptrend which commenced with the earnings from Apple Stock may still have some room to run. Momentum is still positive and the MACD Histogram is flashing a market up signal still. The Ultimate Oscillator shows the market as overbought but today’s action help relieve some of that pressure.
Rate Of Change remains positive although it is turning back down. The Slow Stochastic is overbought as is the Fast Stochastic. However the fast stochastic instead of turning down is flattening out. Looking through my stock market timing journals I can see that when the Fast Stochastic turns flat it seems to move whichever way the majority of the other indicators are pointing. Market direction as called by the stock market timing indicators is sideways to up. Despite today’s selling there are no strong down indicators at this point in the rally.

Stock Market Timing Signals For May 2 2012
Market Direction Summary
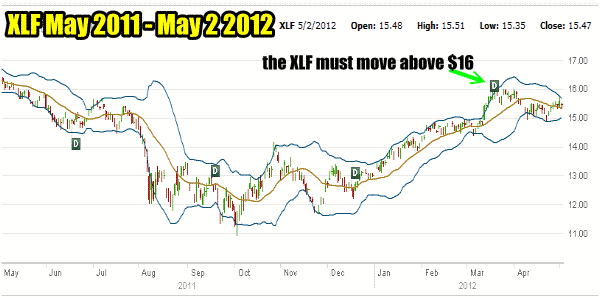
Of interest is the Banking Sector. A lot of investors have given up on the banking sector but looking at the banking ETF XLF, shows that this ETF has had a nice move higher throughout the past 3 months and despite the weakness shown today, the XLF remains bullish. However for this rally to continue with any strength, the XLF must push above $16.00 and continue to climb. My market timing indicators while showing a pullback from an overbought condition are not showing any signs of this market direction cracking. Therefore as long as the XLF continues to climb the stock market direction should remain positive.

The Banking sector has had an incredible run shown in the XLF ETF.
