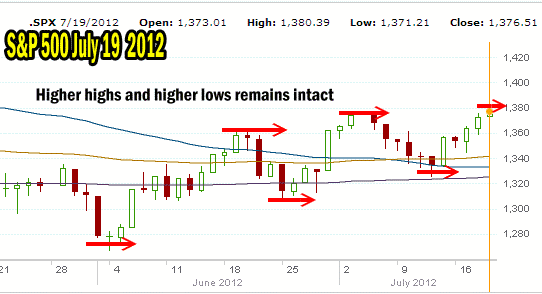
All this week I have written about how market direction has exhibited higher highs and higher lows for the past several weeks, which is a clear bullish sign. Today the S&P continued that market direction move higher and reached an intraday high of 1380 before pulling back to 1376.51. 1380 marks the first significant higher high since this latest rally began and bypasses the previous high of 1374.81 made July 3.
The market is now very overbought but market direction could continue to climb higher albeit with a lot more difficulty. Let’s have a look at the pattern and see what present market timing charts are telling us.
Market Direction Pattern
The S&P 500 market direction for the past several weeks is in the chart below. You can see that since the bottom of the correction in early June, the stock market direction has been for higher highs and higher lows. I earlier wrote that for this rally to continue, the market direction must be pushed up to 1380 and then 1400. That would confirm the market direction as continuing to recover from the selling in May and that the bottom from this last correction was put in back in early June.

Market Direction pattern showing higher highs and higher lows which commenced several weeks ago.
Market Timing Indicators Heading Into Friday July Options Expiry
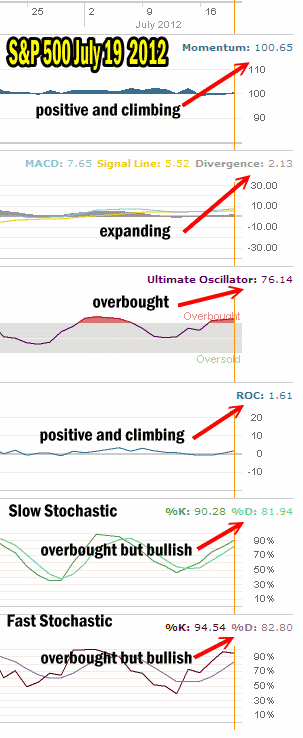
My market timing indicators are now all bullish. There are no bearish readings. This does not mean that the market direction is straight up from here. It does mean that the market direction is still higher but could see some selling for Friday. Let’s look at my market timing indicators at the close of the market today.
Momentum is positive and more importantly it is climbing. However a reading of 100.65 is closer to neutral than it is to raging bull so weakness remains in the stock market. Momentum is showing us that the last few days are not being bought by large investors. These investors remain cautious. Therefore the present market is still a traders’ market.
The MACD Histogram is bullish and expanding on the recent readings as it climbs. We have seen these signals before and as long as they continue to expand any pullback should be short-lived.
The Ultimate Oscillator is solidly overbought, which does not necessarily mean selling will appear tomorrow, but it could and that is what is important to consider. To help decide short-term outlook, it is of benefit to review the other market timing indicators to see if any can confirm market direction or offer further guidance.
Rate Of Change is not negative but instead climbing higher so it is no help for an overbought condition and deciding if the market direction is going to be down for tomorrow.
Slow Stochastic is very bullish with a reading of %K 90.28. It is also very overbought, but it is not unusual for the slow stochastic to reach above 97 before the market pulls back hard.
It is Fast Stochastic then that we want to look at as the last possible market timing tool to shed some light on what the Ultimate Oscillator is warning. Yesterday (Wed) the fast stochastic readings were %K 96.24 and %D 71.67. Today the readings are %K 94.54 and %D 82.80.
By looking at these two days I can tell that there is growing strength in a push to the downside for market direction. %D on Wednesday was 71.67, but today it has climbed to 82.80. %D indicates downside possibility which is as we can see, growing. %K is the upside potential and again we can see that it is falling.
Fast stochastic confirms that Ultimate Oscillator’s reading of overbought is having an impact in the market direction and tomorrow or Monday could see the stock market direction pull back. It might be just a one day pullback of not significant size, or it could start a few days of selling.

Market Timing Indicators for July 19 2012 are all bullish.
Candlestick Chart Analysis
For those readers interested in candlestick chart analysis of the S&P 500, the candlestick at the close today is a White Spinning Top. This candlestick chart analysis shows complete indecision among the bulls and bears as to market direction. It is flashing that a possible sell signal may be on the verge of being generated by the market.
This candlestick chart analysis ties completely into the market direction movements I have mentioned all week. The S&P 500 made a new higher high today. In this recovery from the stock market correction bottom made in early June, a new higher high has been followed by weakness as the market digests the new higher highs and waits to see if investors are going to put more capital to work in the market. When that does not happen the market has sold off and then established a new higher low.
The candlestick chart analysis for today confirms that this trend may be entrenched and selling will start tomorrow. it does not have to be heavy selling, just a negative close. That will confirm that the next few days market direction could be lower for the S&P.
Market Direction Outlook For Friday
Even though the market timing indicators are all bullish, does not mean that the market direction is higher. It means that once selling does resume any downside should not break the pattern of higher lows.
The stock market is overbought. It is not highly overbought but definitely overbought. Analysis of the stock market has to take into account the past few trading sessions as well as the market timing indicators. We have had some good days and the market did make a new higher high today. While it was not a significant gain over July 3rd market high, it was still high enough to keep the pattern of higher highs and higher lows in place.
Tomorrow we could see the market move higher and then pull back. If the pullback continues into next week I will be watching to see if it is short-lived and the market direction returns to up. If the pattern we have seen continues, I would expect either a rise and then selling tomorrow, or a rise tomorrow and then selling on Monday.
As tomorrow is July options expiry, the Trader’s Almanac has shown that in 7 of the last 11 years, the Dow has seen a move lower on the Friday of July options expiry. This year could witness a similar day tomorrow. But until market Direction breaks the pattern of higher lows in any pullback, I will be put selling on any weakness. If however the signs change and the higher lows pattern breaks, then the market direction will have changed to solidly down and will warrant being cautious with put selling until selling slows. I
am not anticipating the stock market direction will move lower for very long. Tomorrow should be an interesting July options expiry as we could see weakness followed by more upside in market direction.
