Market direction for October 4 was a definite down in my technical tools. Looking at all the pieces of the puzzle that makes up market direction, everything pointed to a couple of days bounce and then a move to a lower low. This link will take you to my market direction call for Oct 4. The NASDAQ on its own confirmed the market direction as down when it failed to follow the Dow Jones and the S&P in the last little rally, but instead continued to push lower.
The market since October 4 has seen a nice rebound but did this change the overall market direction?
Market Direction – Chart For Oct 7
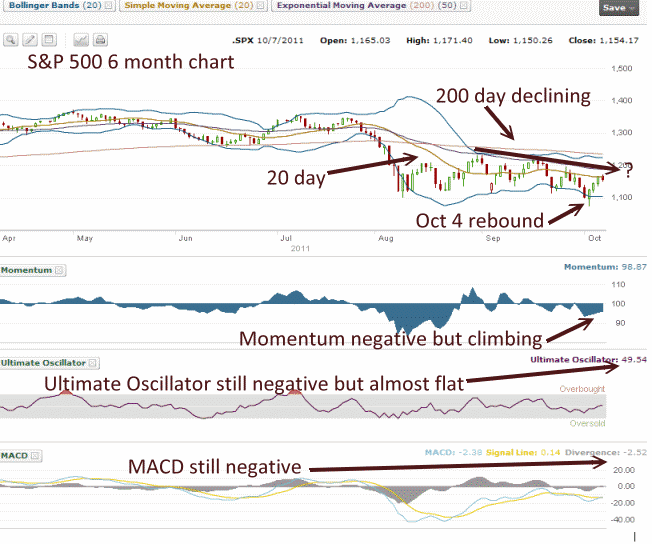
The chart below of the S&P500 for the past 6 months shows that overall the market has declined despite the continual rallies. Rallies like the ones we have experienced are typical of bear markets and not bull markets. Whipsaws are a sign of investor fear and bear markets.
The 200 day is showing that the market direction has been down since the start of August and now marks the start of the 3rd month. Eventually the 200 day will catch up to the market which could aid a rally but this could be later this fall, taking the market into a typical Santa Rally. Even in the bear market of 2008 there was a Santa Rally.
More important though are the other technical indicators. Momentum has been climbing for the past three sessions but is still negative. The Ultimate Oscillator is almost flat but still negative. MACD remains negative.

Market Direction is never a finite process. The market direction hinges on everything from investor sentiment to world events and everything in-between.
Market Direction – Close Up Of The Puzzle Pieces
Below is the past three months of the S&P 500 (July to October 7 2011. The biggest piece to the market direction puzzle I believe is the moving averages. The market has been unable to break through the 50 day moving average. The last rally saw the market rebound to just the 20 day and today the market hit the 20 day and is sitting at the 20 day.
For the market direction to change I believe the market must break through the 50 day, hold above the 50 day and then move higher. The last rally last just 3 sessions. This latest rally against is just 3 days. Market volume remains poor, but overall market volume doesn’t hold as much importance as the MACD does. (Moving Average Convergence Divergence).
I think one of the more important charts to watch is Priceline. This market direction link (goes through an ad first) goes to google finance where you can select different time periods. Check out the 1 year. Priceline is not confirming that the market direction is a clear down. It is indicating sideways with the bias to the downside.
Market Direction – Summary for October 7 2011
The problem for all investors who are trying to figure out the market direction to invest for longer than a day or two, is that the technical signals continually show the market is filled with fear. No investor wants to be holding stocks in the event that the market direction turns decidedly negative simply because they will be cheaper.
But investors also need to remember that the crash of 2008 holds a long shadow but the chance of event repeating itself in the near term is low. They also need to remember that any weakness in the market brings all the perma-bears and doom sayers out to the airwaves. On October 4 as the market broke through the August lows CNBC and BNN (Canada) was filled with bears. This gets investors worried. Instead turn off the media and look at your overall positions.
Are you happy with the stock you hold and are selling calls or sell puts against? What has changed in your outlook? What has changed in earnings momentum for these stocks? Then ask yourself is all this noise about fear in Europe, fear in the credit rating downgrade on the USA, fear of a possible recession, fear of a Chinese slowdown? Do you see the key word throughout – FEAR.
Stand back and look at your positions. When the market direction changes to down, pick the weak stocks and decide how you want to protect the weak ones IF you want to continue holding them. For weaker stocks in a downturn, consider selling deep in the money calls against them. Think for a moment. Why sell today if you can earn more by selling deep in the money calls and earn more than the price you will earn today. If you are wrong and the market direction changes to up, you can buy back those deep in the money calls and roll higher. You are out nothing except giving back the extra capital you earned when you rolled down.
For positions that you have sold puts against and the market direction turns down, consider buying them back and rolling further out and down for net credits. Why take a loss on a stock you wanted to own when you can roll lower, earn more income and possibly be assigned shares at even lower prices?
The market direction I believe is lower, but the strength in the market shows that there are still lots of investors who disagree and who see value in the stocks they continue to trade. This is why I think until the market direction is clear, which could be days, weeks or months away, it’s best to turn down the media and concentrate on the strategies of continuing to add to your income through option strategies that provide protection and profit.

