My market direction outlook for today was for a weak start and then an attempt to push higher. This has not been the case as another big jump opened the market direction push higher and then the day flattened out.
These are not good signs and not the kinds of action that can build a stronger market. These are trading actions which makes me suspect that bigger investors are pumping the market and dumping shares at the other end to earn their gains for the quarter and prepare for a downturn to buy back into the market for another leg higher in March and/or April. One of the best things to look at remains market direction momentum. Momentum can tell every investor how well or how healthy the market direction rise or market direction trend is.
Market Direction S&P 500 5 minute chart
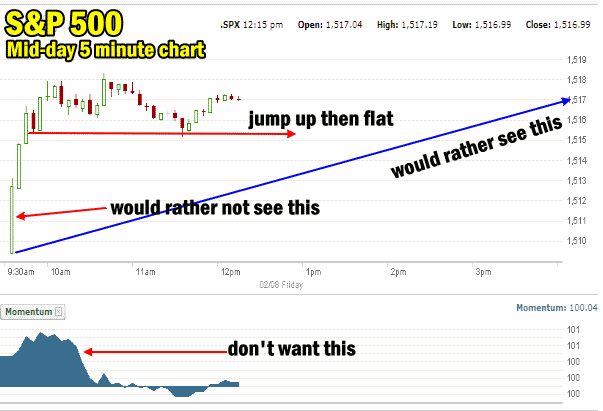
The best way to check the Market Direction daily action is with the 5 minute market direction chart on the S&P 500. Then add the momentum indicator and place it at 10 period. The Market Direction chart you see for today (Feb 8 2013) should look like below.
Again a big Market Direction up jump right at the outset. I would rather not see this move in Market Direction . After the jump within 15 minutes basically the market direction flattened. Again this is not what a healthy market direction move higher shows. You want to see days of the market direction grinding higher like the blue arrow is showing in the chart below. You do not want all your gains first thing in the morning within 15 minutes. It’s often a sign of biggest investors pumping the market direction and then they flatten it out by selling their stocks they have pushed up. This is the “pump and dump” you often hear referenced.
Market Direction Momentum is also showing the same action. Investors get sucked in by seeing a big jump at the start in Market Direction as stocks open higher. Then the institutions sit on a stock and unload their shares. It is better to see a continual push higher in market direction rather than all the action at the outset. This kind of momentum technical indicator image often shows that bigger investors are priming stocks to push them up to dump shares.
market direction intraday 5 minute chart
Market Direction and Overall Stock Direction
To check on pump and dump Market Direction action, all investors have to do is check out big name stocks. Institutions trade in all kinds of different stocks from speculative stocks to juniors to big caps. However institutional investors put their big dollars in big cap stocks for obvious reasons which is why I trade primarily within the big cap stocks as well.
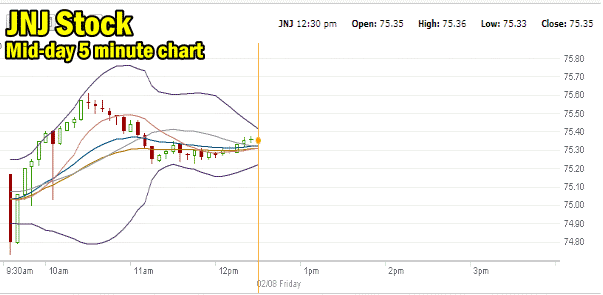
Below is Johnson and Johnson Stock chart this morning. A drop in the stock at the outset this morning was halted and pushed right back up. Then the unloading of shares begins as Johnson and Johnson Stock sits at new 52 week highs.
Market Direction and Johnson and Johnson Stock 5 minute chart
Market Direction and Pump and Dump Action – Volume Indicator
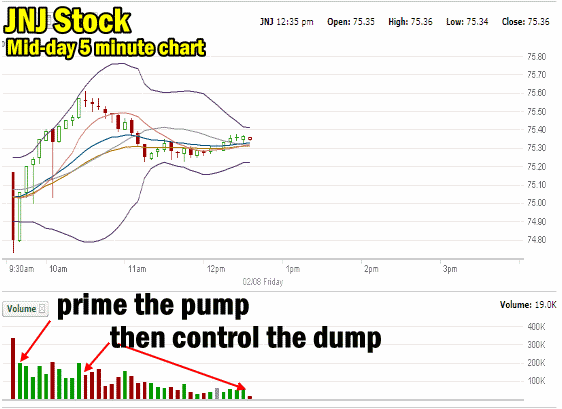
Add in the volume indicator and you can see the pump and dump in action on lots of large cap stocks. The Johnson and Johnson Stock shows the market direction pump and dump action. The pump is primed to correct the selling and push the stop back up. Then you can see the dumping. Institutions hold so many shares this takes days to weeks and the only way to control the dumping of shares is to also control the priming of the pump. They have to be careful not to suppress the stock they want to get out of. At the same time they have to gauge how much stock they have to buy to push the stock up enough to keep investors interested in buying the stock.
Market Direction and Pump and Dump Action – Money Flow Indicator
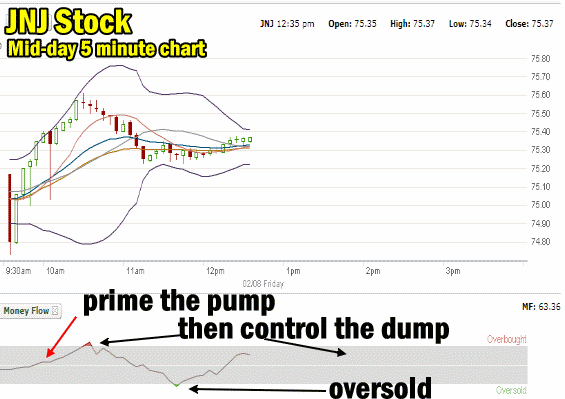
The money flow indicator also shows this market direction pump and dump action.The 5 minute intraday chart below shows again the priming of the pump. Then as the overbought signal enters the dumping of the shares begins. I have marked on money flow where it became oversold. In other words too many shares were being dumped and buyers started to drift lower. This money flow indicator is set for 14 which is the default most investors use.
Market Direction and Johnson and Johnson Stock money flow indicator
Market Direction and Pump and Dump Action – Johnson and Johnson Stock
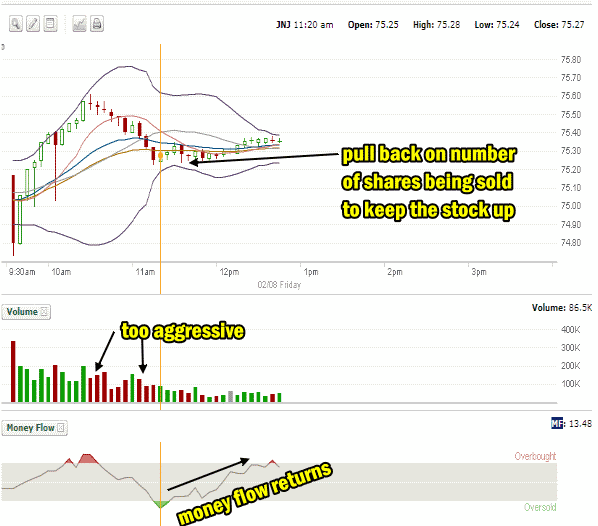
Change money flow to 10 period and you can really get a good feel for the day’s action and how the pump and dump works. With the big market direction jump higher, institutions pick the stocks they want to push and buy enough in the morning to get other investors interested. They then sell shares shown by the volume bars below. Red volume shows they are dumping a lot of shares and slowly pushing the stock lower. Green is where they pull back a bit.
By adding the two technical indicators together you can see how when the dumping pushing the money flow to oversold, the seller(s) ease up or pull back on the number of shares they are dumping. This keeps the stock up and it also keeps overall Market Direction up. They were too aggressive at the outset in dumping shares but since they need to unload both the shares they just bought in the morning and their longer-term shares which is their primary goal, they had to take advantage of the renewed interest to unload shares. Once the oversold indicator shows up, the dump that was so aggressive earlier, slows to keep the share valuation up. Investors who are buying figure that this must be a good place to buy in since the stock doesn’t seem to want to fall further and so they buy. Little by little the seller(s) slowly moves higher in small nickel and dime increments to keep the buyers buying at what the buyers feel are good prices since they are lower than the day’s high and money flow returns to the stock with the buying action of investors.
Understanding the Money Flow Indicator
The money flow indicator is a very simple tool. It is indicating the rate at which money is flowing in or out of a stock (or asset). It is better than Relative Strength Index (RSI) or the Ultimate Oscillator in that it includes the volume of shares being traded within the calculation that it is doing. Therefore money flow is excellent at telling you what is going on within a stock. You can set the money flow indicator for any period of time and use it for intraday, daily, weekly, monthly or whatever time frame you want to see what is happening within a stock.
Pump and Dump and Market Direction
Why watch for this kind of action? It is a great way to watch for when market direction up or down may be slowing. The above pump and dump often happens when market direction up has been strong and stocks have had a very nice rise indeed. Much of this week has seen market direction turn sideways. This sideways movement in Market Direction is often a signal to larger investors to dump shares and lock in profits. This pump and dump action can now be seen in a multitude of big cap stocks and could be a strong signal that the bigger investors feel that the market direction push higher has been overdone and the market will pull back, allowing they to buy back in at lower prices and repeat the process in the next Market Direction leg up.
Pump and Dump and January – February Effect
Often January has seen excellent market direction rises. Rises in Market Direction in January are often overdone. February tends to be the weakest of the 6 best months of the year for stocks and market direction often slides in February. This though is very understandable since January often sees a huge Market Direction rise and February becomes a profit taking month. By the end of February many profits have been locked in and often stocks are down 4 or 5 percent. Then March and April enter the picture and suddenly the market direction moves even higher than it was in January. This has been the Market Direction trend for many years including before the bear market of 2008-09.
February’s Market Direction action allows the biggest investors a chance to lock in profits and bottom fish on large caps that have slid in valuations. Therefore right now with the market direction poised at 5 year highs I will not be surprised to see weakness enter the market direction next week and into the third and possibly final weeks of February. This week has seen a lot of pump and dump action on many stocks as Market Direction has shifted to sideways. If it is coming to an end then watch for weakness in the market direction as the largest of investors, the institutional traders start to push stocks lower to grab them cheaper for another leg higher in March.
Manipulation of stocks in this manner is not illegal and has gone on for decades. It is the smaller investors who need to understand that it goes on, spot it, learn to avoid buying into it and profit from it by following the lead of the biggest investors. Smaller investors also need to understand that short-term market direction can be influenced by this action but over the longer-term, pump and dump does not impact the market direction trend, it merely delays whichever way the longer-term market direction trend is heading.
Internal Market Direction Links
Profiting From Understanding Market Direction (Articles Index)
Understanding Short-Term Signals
Market Direction Candlestick Daily View (Members only)
Market Direction Portfolio Ongoing Trades (Members only)
