There are lots of signals to discuss this evening regarding stock market direction. On Tuesday the Dow made another new high and has now reached market highs not seen since December 2007. The all time Dow Jones high was October 9 2007 when the Dow reached 14166.97. However the day’s high which was made just shortly before noon, was quickly lost as the Dow closed up 69.07 points. A rally in the early afternoon trying to regain the morning high failed to reach the morning high which brought in sellers.
But while the Dow has made new market direction highs, the NASDAQ is being pulled down by stocks like Intel Stock which has lost 7.4% over the past two days. Intel Stock tried to rally today but closed the day up just 8 cents or 0.34%. The NASDAQ rally today fizzled out. When investors saw the NASDAQ fizzle, they began selling a multitude of stocks.
The S&P 500Market Direction
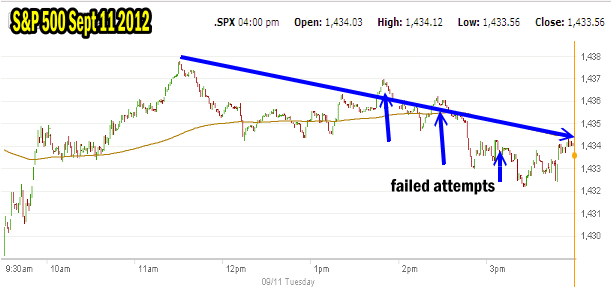
The S&P 500 faced the same problem as the Dow. The chart from Sept 11 2012 trading shows the morning high and then like the Dow, sellers stepped in. Three rally attempts failed and the S&P closed up 4.48. This is still respectable performance but there are a number of warning signs of possible selling ahead, to consider. The NASDAQ exhibits the same pattern as the S&P 500 for market direction.

The market direction on the S&P 500 looked good in the morning but selling quickly cut back the potential rise.
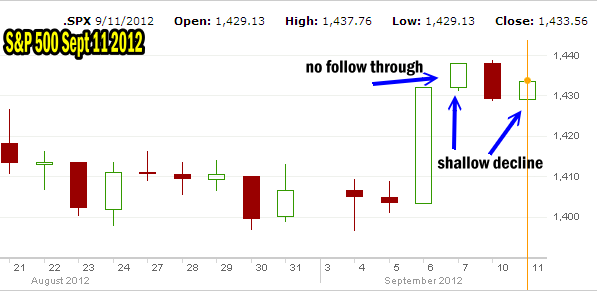
The S&P 500 market direction since the rise on Friday has seen no follow through. Monday saw selling and today’s move back up while decent, did not erase the previous day’s selling. Basically look at the chart below you can see the decline in the S&P and then the big jump last Thursday after the ECB announcement. The move back over the past two days may be nothing to be concerned about, but the move back has to be stopped and turned back around, otherwise the S&P will have made a new high and then fallen, which for many investors is a sign to jump ship as it were.

There has been no follow through on the recent new market direction high in the S&P 500
No Market Direction Confirmation Among Indexes
While the Dow made another new high today, there has been no confirmation among the three indexes. Indeed the NASDAQ which lead the entire recovery from the bear market of 2008 to 2009 is still having trouble.
Market Timing Technical Tools
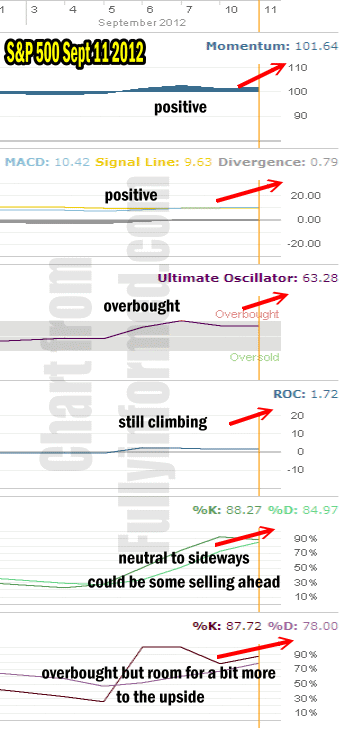
The stock market direction market timing technical tools are by and large still supportive of a possible move higher in the S&P, but there are some signs to be wary of.
Momentum is positive and slightly higher than yesterday’s reading.
The MACD Histogram is higher than yesterday which is another good sign that the market direction up should continue.
The Ultimate Oscillator is slightly lower today than yesterday but is still overbought.
Rate Of Change market timing indicator is climbing higher than yesterday which is natural since today the market closed up.
The Slow Stochastic though is another market timing tool worth heeding. It shows that the market is overbought, but there is a sideways momentum growing and a chance for the market direction to shift back down.
The Fast Stochastic is moving back to overbought but not as bad as Friday’s extreme overbought reading. Nonetheless the market remains overbought and the Fast Stochastic is indicating that there is room to move higher but there is a lot of pressure building to pullback in market direction.

Market Timing Technical Indicators For Sept 11 2012
The overall consensus is still for the market direction to continue higher, but from experience, with 3 indicators warning of an overbought condition remaining in the S&P 500 and the chance of the index pulling back, I will be waiting to see what happens Wednesday and Thursday of this week.
VIX Index and Market Direction
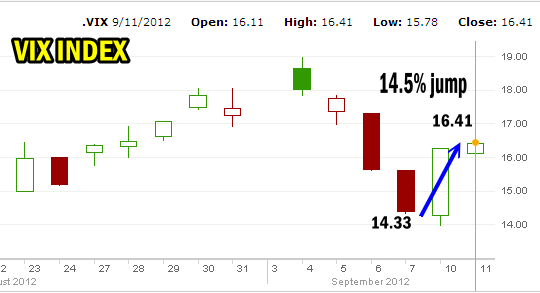
One other market timing took that is worth looking at is the VIX Index. Here is a great article on the VIX Index which explains how some investors use the VIX Index to assist in timing the market. The VIX Index has taken an unusual turn over the past three trading sessions. On Friday the VIX Index made a low of 14.33. On Monday the VIX Index fell below 14 and then made a huge reversal. Today the VIX Index continued that reversal and closed at the high for the day of 16.41. This marks a huge jump of 14.5% and indicates a huge reverse in investor sentiment. With the market direction making new 5 year highs on the Dow and S&P 500 investors may be getting anxious and could start to sell.
Indeed today, many of the stocks I followed were having a very good day and then began to fall back. Stocks like Microsoft stock ended up just 7 cents. Nucor Stock which had been up to $39.59 closed up just .15 cents. Apple Stock which was as high as $670 early in the day closed down 2.15 at the close. Many stocks I followed had the same pattern as the indexes. They pushed higher before noon and then pulled back for the rest of the day. Most closed up modestly higher.

The VIX Index can be used to assist in predicting market direction.
Market Direction Outlook For Wed Sept 12
Market Direction outlook for Wed Sept 12 is of caution. While the bulls appear in charge of market direction, there are enough warnings signs to have me stay on the side of caution with my capital. Today I closed my VISA Puts for September but left open my Oct VISA naked puts. I am staying with the Cautious Bull strategy.
While I see no major downturn on the radar now, the fact that the three indexes are no longer following each other’s market direction trend, the VIX Index had a huge reversal of sentiment and the three market timing technical tools are showing signs of extreme bullishness, are all signs that tell me market direction may have some trouble here and may have to turn lower before it can turn higher.
