Market Direction remains the key element to investment success. Friday’s close pushed all the market timing indicators into bullish readings, but as always there are issues that have to be resolved before the market direction can continue higher.
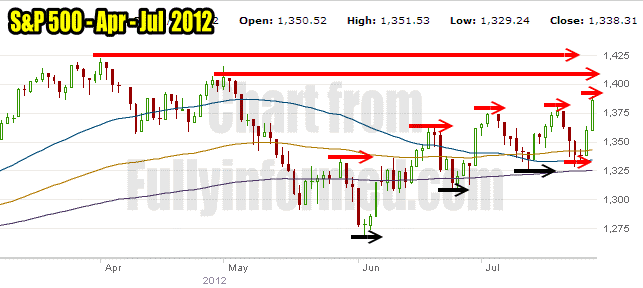
The most interesting chart remains the S&P 500 market direction of higher highs and higher lows which started at the beginning of June. Despite all the media and all the issues out of Europe, the market direction up, has remained intact. Last week came close to seeing that break, but the market direction turned around as soon as it came close to 1328 and pushed back up. Two solid up days has recovered the market direction into another higher high.
All the major indexes are now exhibiting this same market direction pattern, which is obviously a bullish sign.
Just a few weeks ago the media was filled with news of how the S&P 500 and the Dow had their second worst days in 2012. Now no one even remembers those reports. This is one of the most important reasons for staying consistently with Selling Options. Market direction swings can leave many investors dumping shares and then buying them back. Investors are jumping in and out of stocks as the market direction whipsaws them, but for those of us who do Options Selling we can stay the course and keep generating income while other investors fret the overall market direction.
S&P 500 Market Direction Chart
The chart below shows the continuing pattern of higher highs and higher lows as the market direction slowly continues to work its way higher. On Friday the market direction pushed into another new higher high as the stock market tries to recover from the April and May sell off. Thursday and Friday were solid up days with large volumes.

The higher highs and higher lows are obvious on this S&P 500 market direction chart.
But two solid up days often can push a stock market direction into overbought and that is what a couple of the market timing indicators are signaling for the start of this week.
Market Timing Indicators
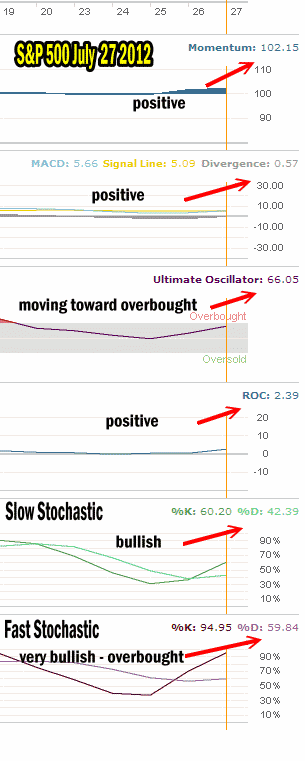
I had a request for more market timing indicators information as to settings so I will address that as I go through the market timing readings for this week. On Friday Momentum rose slightly from Thursday which surprised me after such a big rally again on Friday. This could be warning that the market direction is pushing into overbought and investors are pulling back once again. I use the 10 period for the market timing Momentum indicator tool.
MACD Histogram took a big jump up from Thursday’s reading and is now into positive signals. For MACD Histogram I am using 13, 26, 9.
The Ultimate Oscillator is quickly pushing into overbought but there is still some room to rise before a firm overbought signal is generated.
Rate of Change is solidly bullish and climbing. Again I am using a 10 period.
The Slow Stochastic is now bullish. I am using 14, 3 settings.
The Fast Stochastic is very bullish and signaling a solid overbought readings. I use 20 and 5 for my settings.

The market timing indicators are primarily bullish going into this week. Two are signaling overbought conditions lies ahead.
Market Direction and Market Timing Outlook To Start The Last Week Of July
All the market timing indicators are bullish. Two are signaling that the market direction has been pushed into overbought. Presently this could push the market down for the start of the last week of July. A few statistics from the Traders Almanac that supports the weak outlook to start the week. In the last trading day of July the NASDAQ has been down in 5 of the last 6 years. In the first trading day of August the Dow has been up in 3 of the last 4 years and the Russell 2000 (small cap) has been up in 6 of the last 7 years. Finally, in the first nine trading of August, the markets have tended to be generally weak.
With all the indicators bullish, but overbought indicators particularly on the fast stochastic, I have to expect that the market will be weak to start but may gain some momentum as the week progresses.
At this stage any dip is my Put Selling opportunity but for covered calls I will be holding off until I see if the market can continue to gain more ground. I do not want to sell covered calls if the market is going to push higher. I would prefer to see the market direction stall out before selling covered calls.
Any whisper from the Federal Reserve about printing money or engaging in QE3 will set this market on fire. As long as Europe remains contained for the next few weeks the market has a good chance to recover here and push the market direction towards the highs set in May and then April.
