My Market Direction Outlook for the final week of August has some warning signs. Not a lot mind you, but certainly there are enough warning signs outside of my market timing technical indicators that should be watched. This week Bernanke speaks on the last day of the month. That day is a Friday so watch for a lot of volatility this week and on Friday especially. If there is no hint of QE3 there could be some selling on Friday as traders will not want to be holding positions over the weekend. The 30th of August has only seen market direction up twice in the last 15 years according to the Traders Almanac. Meanwhile though the Dow has been up the day after Labor Day 13 of the last 17 years so that could be a positive going into the weekend.
Market Direction and The Dow Transports Index
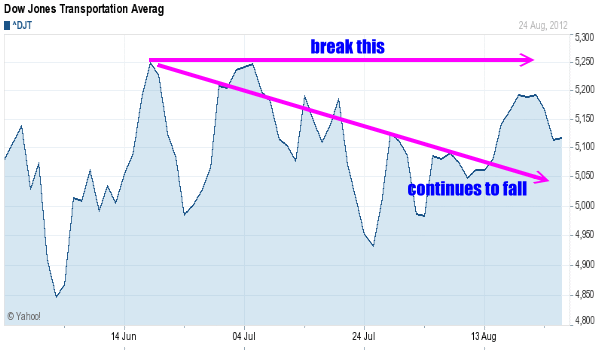
The Dow Transports is not confirming this latest rally that started on August 3. The Dow Transports index is trending down. Each successive high is lower than the previous high. It has failed to break the high set mid-June, so while the stock market has been recovering from the April to May decline, the transports have failed to confirm this rally and investor attempts to break the April stock market highs.

The Dow Transports Index is trending the wrong way.
Market Direction and the S&P 500
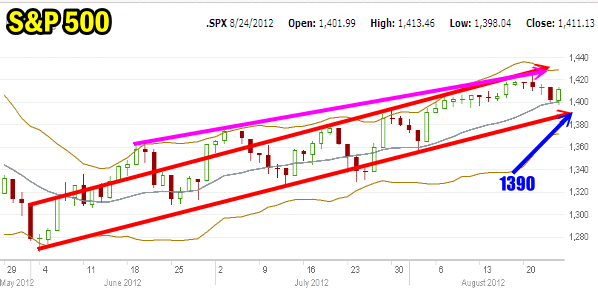
The S&P 500 market direction is sliding away from the high made on August 17 but this could be just a consolidation of market direction to work off the overbought condition. The two trading sessions after the August 17 high tried to punch into new highs but resistance was too strong and the intraday highs were not held. This is normally bearish. Right now the S&P can fall to 1390 and the uptrend would still remain intact so there is room for the S&P to pull back and try to consolidate a bit more.
For the higher highs, it does not matter whether I choose the June 1st opening high (red arrow) or the June 16 high (pink arrow). The destination is still the same. The S&P must break through 1430 to keep this rally alive.

The S&P 500 is hanging on but market direction is having trouble moving into new ground.
Market Direction and Market Timing Indicators
The US Dollar chart which I was going to post but which I am sure most investors are aware of, looks like it wants to climb again. Normally the US Dollar has had an adverse effect on stocks. If it rises, stock market direction pull back and if the US dollar falls, stock market direction climbs.
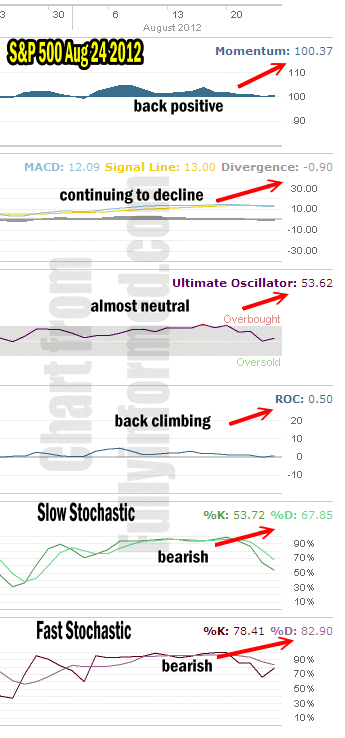
My market timing indicators are not overly concerned about market direction but at the same time they are tending to be more bearish than bullish with two back positive, 1 neutral and 3 bearish.
Momentum is back positive but with a reading of just 100.37, even a little selling will move it back to negative and point market direction back down.
MACD Histogram which is one of the better indicators for market direction in general, continued to decline on Friday despite the rally.
The Ultimate Oscillator is back positive but closer to neutral so again any amount of selling can push this indicator to be negative.
Rate Of Change is barely positive, but that should be expected after Friday’s market direction reversal back up.
Finally we come to the two stochastic indicators. They have been the most accurate throughout this spring to summer period in the S&P 500.
The Slow Stochastic remains bearish as does the Fast Stochastic. Friday’s rally made them “less bearish” in their readings but overall they remain decidedly bearish on the market direction.

Market timing indicators are tending to be bearish as a general consensus
Candlestick Chart Analysis
For those who follow candlestick chart analysis, Wednesday selling brought out a sell signal right after a buy signal had been generated. Friday though saw a buy signal confirmed again on the S&P 500, but since the start of this rally back in June the Candlestick Chart Analysis has been only about 40% accurate on market direction.
Market Direction Outlook For The Last Week Of August 2012
This may very well end up being an important week for the stock markets as far as market direction goes. I won’t be surprised to see some selling to start the week and I also won’t be surprised to see a little rally mid-week as investors remain optimistic that QE3 is just around the corner. Personally I hope the Federal Reserve holds here and waits to see where the economy is going to head. Some signs of life are encouraging including housing and employment numbers while poor are still positive month after month. There are many problems facing the economy but then there are always problems. The price of oil is once more pushing toward $100 which can choke off employment and spending. But if the Federal Reserve acts now I must wonder what ammunition would be available if the economy begins to tank later this year or into the early part of next. I would think it would be better to wait until you see “the whites of their eyes” as the old saying goes. But investors love liquidity and are holding their breath to see if the market direction can continue higher. I have about half of my capital still in cash along with 30% which I always keep in cash so I am well prepared for just about anything the market direction wants to throw at me. But the strategy of the cautious bull is worth remembering at times like this.
The market direction is no longer overbought. It could be a question of consolidation and then a push higher but if the Fed disappoints too much on Friday we could easily see the market fall to 1395 or 1390. The question then will be can it hold there and keep the market direction uptrend intact.
