Market direction outlook going into today was basically stay cautious and stay invested. By staying with smaller positions and keeping cash at the ready I feel quite comfortable going into the second half of February. Today’s market direction got a boost from German data showing investor confidence was at its highest level since April 2010. I don’t hold a lot of value in this type of survey as investors can lose that confidence quickly. Instead I would prefer to see growing economic reports out of Europe which so far is not happening. Interestingly confidence among US home builders apparently fell to 46 from last month’s 47 reading which results in D R Horton stock falling 1.8 percent and PulteGroup Stock down 1.8 percent.
Market Direction Action For Today
Today’s market direction action up was broad-based and volume was decent with the advance decline line continuing to advance. Dell Stock inched higher despite a drop of 14 percent in sales in the latest quarter as Michael Dell continues to try to take his company private. Dell stock closed at 13.80 but rose another 7 cents in after hours trading although Michael Dell is trying to take the company private for $13.65 a share. There is a lot of back lash from investors who do not wish to tender their shares so don’t be surprised to see the price to go private rise.
In Canada Great West Life Stock (GWO) was up 2.4 percent on news that they are buying Irish Life Group Ltd for 1.75 billion. This is a major acquisition for Great West and should make the stock a lot more interesting from a Put Selling view-point. Perhaps now volatility will rise in the stock. Reports of Office Depot and OffficeMax possibly merging also helped the market today with OfficeMax jumping 20.9 percent and Office Depot up 9.4 percent. Despite not being involved, Staples Stock rose 13.1 percent. None of these office supply companies interest me even remotely. They are all in trouble as far as I am concerned and merging may help in the short-term but longer-term their market is changing and I plan on staying far away from trading in any of them.
Market Direction Closings
The S&P 500 closed at 1530.94, up 11.15 points and the Dow closed at 14,035.67, up 53.91points. The NASDAQ closed at 3213.59 up 21.56 points.
Market Direction Technical Indicators At The Close of Feb 19 2013
Let’s take a moment now and review the market direction technical indicators at today’s close on the S&P 500 and view the next trading day’s outlook.

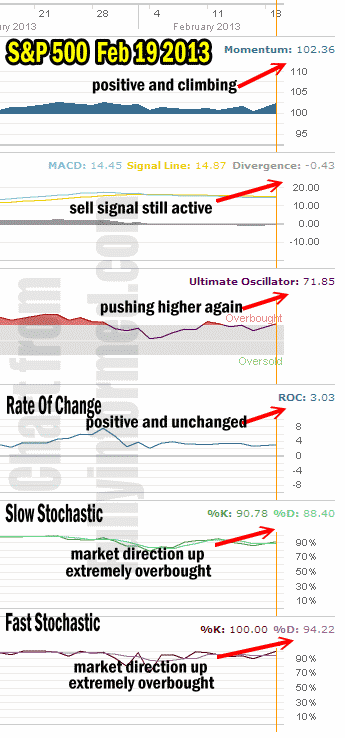
market direction technical analysis Feb 19 2013
For Momentum I am using the 10 period. Momentum is still positive and back climbing higher today.
For MACD Histogram I am using the Fast Points set at 13, Slow Points at 26 and Smoothing at 9. MACD (Moving Averages Convergence / Divergence) is still negative although it took a big jump today. Despite this though MACD is still confirming the sell signal from February 4.
The Ultimate Oscillator settings are Period 1 is 5, Period 2 is 10, Period 3 is 15, Factor 1 is 4, Factor 2 is 2 and Factor 3 is 1. These are not the default settings but are the settings I use with the S&P 500 chart set for 1 to 3 months.
The Ultimate Oscillator is still positive and is back climbing into overbought territory.
Rate Of Change is set for a 21 period. Rate Of Change is still positive but by and large it remains unchanged. This pattern among the ROC indicator is advising that despite moves up and down the overall push in either direction is actually relatively subdued.
For the Slow Stochastic I use the K period of 14 and D period of 3. The Slow Stochastic is overbought to the extreme but the sideways signal has been replaced with a market direction up signal.
For the Fast Stochastic I use the K period of 20 and D period of 5. These are not default settings but settings I set for the 1 to 3 month S&P 500 chart when it is set for daily. The Fast Stochastic is also extremely overbought but it too is confirming market direction is up.
Momentum Technical Indicator
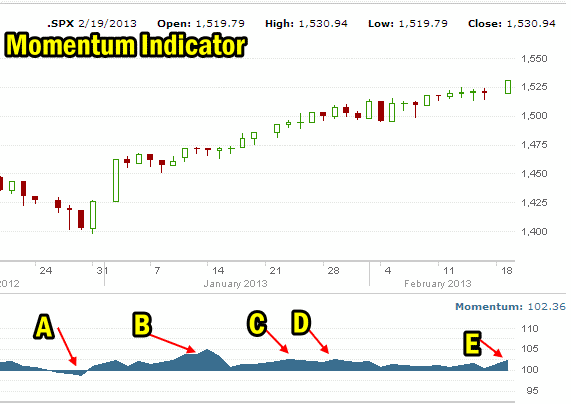
The market direction momentum technical indicator has remained the best technical indicator for this rally. I have marked the key aspects of the momentum daily chart within the chart.
A. December 30 2012 was the last time momentum was negative. Starting on December 31 momentum turned positive.
B. From January 9 to January 15 momentum was the strongest. On January 14 momentum gave a strong reading of 104.87 which has not been repeated.
C. Momentum pulled back as the rally progressed and has been unable to recapture the strength of the period B in the chart below. On Jan 23 momentum peaked at 102.58.
D. On Jan 29 momentum again peaked at 102.53.
E. Today reading at the close was 102.36. Note how these readings do not have higher peaks but instead are giving lower peak readings. We should watch tomorrow and Thursday to see if momentum can move higher and give stronger readings to possibly break C or D peak readings. This would indeed be bullish.

Market Direction Momentum Indicator Since December 2012
Despite the decline in momentum in recent trading days, it has been exceptionally good at predicting the movement in the market direction. Since December 31, it has remained up and continues to predict that the market direction will continue to be positive.
Market Direction Outlook And Strategy for Feb 20 2013
The market direction continues to defy the odds as it climbs higher, setting new 5 year highs in the S&P 500. I believe momentum should be the primary indicator to weigh the most evidence against. Meanwhile though all the indicators except for 2 have moved higher and are continuing to point to strength in the market direction.
I believe the strategy should remain exactly as before. The Plan remains to stay cautious and stay invested but take small positions and close when decent profits are made. Keep capital at the ready for any opportunity but don’t be surprised if the market direction continues to grind higher. At some point there will be a correction but by placing trades on dips and closing them on gains I am continuing to earn excellent profits while at the same time keeping much of my capital unexposed for more than a few trading days. This strategy is what I used in the market top of 2007 and it worked very well. At this point though, the S&P 500 market direction is not exhibiting any signs of topping out.
Today’s market direction outlook then is to Stay With The Plan.
Internal Market Direction Links
Profiting From Understanding Market Direction (Articles Index)
Understanding Short-Term Signals
Market Direction Candlestick Daily View (Members only)
Market Direction Portfolio Ongoing Trades (Members only)
Market Direction External Links
