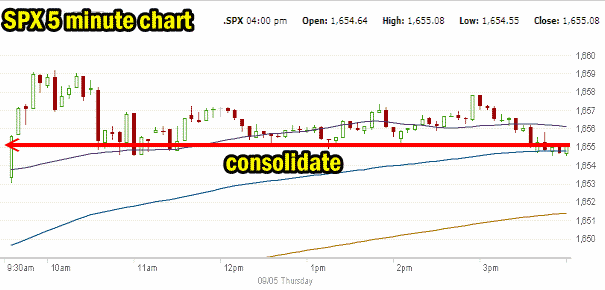
The Market Direction outlook for Thursday was exactly as predicted by the market direction technical indicators – consolidation. While the markets could have been stalled by awaiting the jobs numbers for tomorrow, personally I think investors are consolidating positions. Particularly when the Institute for Supply Management (ISM) came in at 58.6 market the highest reading since December 2005 and up again from an impressive 56 from July. As well overseas, ECB President Mari0 Draghi kept interest rates unchanged and announced they would stay that way for an extended period still.
All of this and the stats I reported in my intraday outlook probably points to the Fed beginning to trim the Quantitative Easing program sooner rather than later. One other aspect of today’s news not to forget is the Weekly Initial Unemployment Insurance Claims came in around 6 year lows and while still nowhere near 250,000 which is the number that tells us the economy is just humming along, were still good enough to tell us that a major correction in stocks is not around the corner yet. You can read more on this in the intraday market comments here.
Market Direction Action For Sep 5 2013
The morning opened with a slight move higher and the rest of the day the market stayed almost flat. At the close the market was up just 2 points closing pretty well where it had been within minutes of the opening. the most important aspect of today is no drop to test 1650 or even try to.

Market Direction Action IWM ETF
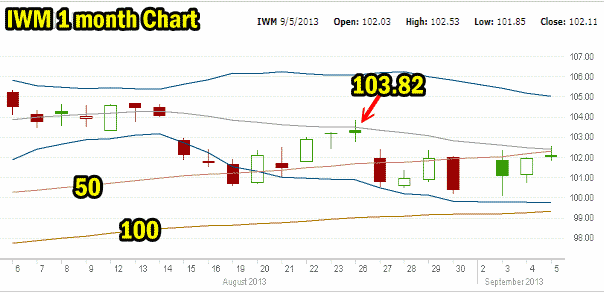
The other market direction I have been watching is IWM ETF. This Russell 2000 ETF is just sitting below the 50 day simple moving average (SMA). You can see in the chart below that today’s very slight move higher (0.16) has the 50 day hanging above it. The IWM needs to break beyond 103.82 to confirm the trend down may have changed to up. This is what I am watching.

Advance Declines For Sep 5 2013
Advancing issues actually lost out to declining issues by the close but by and large everything was close to neutral with 47% of stocks up and 50% down. New highs though are still too low at 114 versus 158 new lows. The market direction up needs more new highs than lows to really put in a decent rally.
Market Direction Closing For Sep 5 2013
The S&P 500 closed at 1,655.08 up 2.00. The Dow closed at 14,937.48 up 6.61. The NASDAQ closed at 3,658.78 up 9.74.
Market Direction Technical Indicators At The Close of Sep 5 2013
Let’s review the market direction technical indicators at the close of Sep 5 2013 on the S&P 500 and view the market direction outlook for Sept 6 2013.

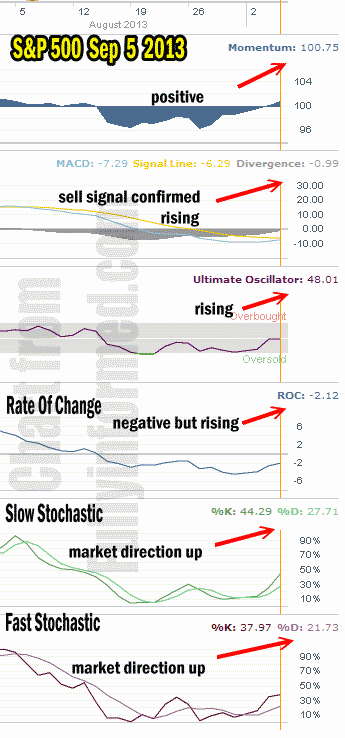
For Momentum I am using the 10 period. Momentum is now sitting back on the positive side.
For MACD Histogram I am using the Fast Points set at 13, Slow Points at 26 and Smoothing at 9. MACD (Moving Averages Convergence / Divergence) issued a weak sell signal on July 31 which was confirmed August 7. MACD is higher yet again today and took a big jump up with a negative reading of just 0.99. This could easily turn to a buy signal tomorrow if the market direction pushes up even slightly with limited selling.
The Ultimate Oscillator settings are Period 1 is 5, Period 2 is 10, Period 3 is 15, Factor 1 is 4, Factor 2 is 2 and Factor 3 is 1. These are not the default settings but are the settings I use with the S&P 500 chart set for 1 to 3 months.
The Ultimate Oscillator is no longer oversold and is about to turn positive which is a good sign for more upside.
Rate Of Change is set for a 21 period. The rate of change is negative but took a move up indicating that a lot of investors were still buying positions.
For the Slow Stochastic I use the K period of 14 and D period of 3. The Slow Stochastic is signaling that the market direction is up. It is no longer oversold.
For the Fast Stochastic I use the K period of 20 and D period of 5. These are not default settings but settings I set for the 1 to 3 month S&P 500 chart when it is set for daily. The Fast Stochastic is indicating that the market direction is up and it too is no longer oversold.
Market Direction Outlook And Strategy for Sept 6 2013
The market direction technical indicators are all pointing to a better day for tomorrow and the slow stochastic is indicating that the market direction may extend any upward movement into the start of next week. Tomorrow though is the jobs numbers. Overall I am expecting a reasonably decent number. Nothing huge but a number showing continued growth in the number of people employed. That might be all it takes for the market direction to push higher tomorrow. If however for some reason the jobs numbers come in poorly then it might be more a sideways market. A poor number may give pause to the Fed plans to scale back Quantitative Easing. I don’t see how the numbers could be poor considering the Weekly Initial Unemployment Insurance Claims have been strong for the past 4 weeks.
My strategy is unchanged. I am selling puts here and there when the opportunities arise. I am taking smaller positions but still selling puts. The market direction portfolio at present is still sitting perfect for the market. Tomorrow then the market direction indicators point to a higher day. It now comes down to the employment numbers which are released before the market opens.
Market Direction Internal Links
Profiting From Understanding Market Direction (Articles Index)
Understanding Short-Term Signals
Market Direction Portfolio Trades (Members)
Market Direction External Links
Market Direction IWM ETF Russell 2000 Fund Info
Market Direction SPY ETF 500 Fund Info
