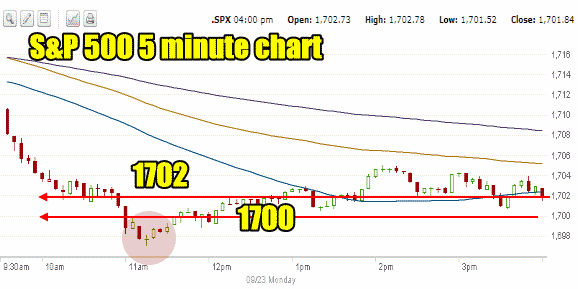
The market direction outlook for today was for the market to move more sideways than up or down. Investors though decided to push the market lower right at the outset. You can see today’s market direction action in the 5 minute chart daily chart below.
By 11:00 the market had broken through the 1700 level. It then turned back up to push above 1700 and drifted sideways. In my intraday comments today I remarked that it was important for the S&P 500 to not close below 1702. The S&P tried to hold 1702 but by 2:00 PM the high for the afternoon was in and the last two hours saw the market direction keep moving lower. Amazingly the S&P 500 managed to close at 1701.84.

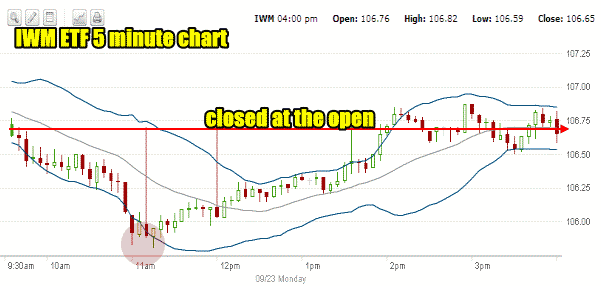
Market Direction Action IWM ETF
The more interesting chart for today is the IWM ETF which is the Russell 2000 small to medium cap ETF. It fell the same as the rest of the market and by 11:00 it put in place a bottom. From there though the IWM climbed throughout the afternoon until it turned positive shortly after 2:00. It then drifted sideways and closed near the open valuation. A nice recovery for the IWM ETF and perhaps a signal of more strength in the market than we realize.

Advance Declines For Sep 23 2013
The advance decline numbers for today were not nearly as bad as Friday’s. 41% of stocks advanced versus 56% declined. New highs were 97 and new lows 93. You can see from the numbers the market direction really was split.
Market Direction Closing For Sep 23 2013
The S&P 500 closed at 1,701.84 down 8.07. The Dow closed at 15,401.38 down 49.71. The NASDAQ closed at 3,765.29 down the least of the 3 indexes moving lower by $9.44.
Market Direction Technical Indicators At The Close of Sep 23 2013
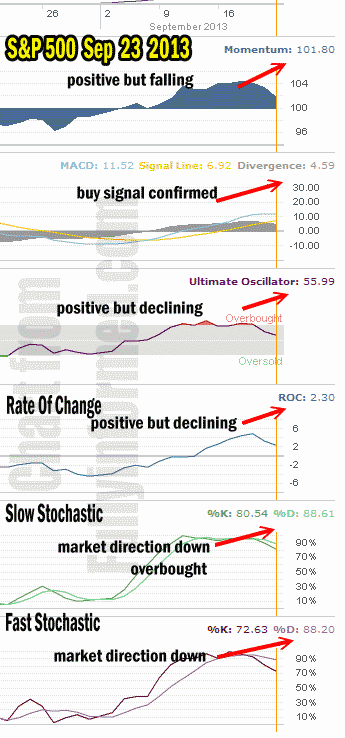
Let’s review the market direction technical indicators at the close of Sep 23 2013 on the S&P 500 and view the market direction outlook for Sept 24 2013. 
For Momentum I am using the 10 period. Momentum is positive but is continuing to fall.
For MACD Histogram I am using the Fast Points set at 13, Slow Points at 26 and Smoothing at 9. MACD (Moving Averages Convergence / Divergence) issued a buy signal on Sep 9 which was confirmed on Sep 10. MACD is also pulling back and closed still positive but with a lower divergence of 4.59.
The Ultimate Oscillator settings are Period 1 is 5, Period 2 is 10, Period 3 is 15, Factor 1 is 4, Factor 2 is 2 and Factor 3 is 1. These are not the default settings but are the settings I use with the S&P 500 chart set for 1 to 3 months.
The Ultimate Oscillator is pulling back. Another down day tomorrow and it will probably turn negative.
Rate Of Change is set for a 21 period. The rate of change is also continuing to fall today but is still positive.
For the Slow Stochastic I use the K period of 14 and D period of 3. The Slow Stochastic is signaling that the market direction is down. It is overbought.
For the Fast Stochastic I use the K period of 20 and D period of 5. These are not default settings but settings I set for the 1 to 3 month S&P 500 chart when it is set for daily. The Fast Stochastic is signaling that the market direction for tomorrow is lower.
Market Direction Outlook And Strategy for Sept 24 2013
In my Market Direction comments on the weekend I indicated that Tuesday was important. I expect tomorrow we will get a better clue as to the next direction the market will take. Now with the 1700 looming ahead and with the Fast Stochastic and Slow Stochastic signaling a lower market direction for tomorrow, we could see the 1700 break. If it does and fails to recover I will be placing Spy Put Options in play as well as adjusting the market direction portfolio to lower.
It is important to remember that while MACD, momentum, rate of change and the Ultimate Oscillator are all moving lower, none are negative at this point. Therefore the market direction is probably ready to issue a clear signal tomorrow that should be tradable.
Market Direction Internal Links
Profiting From Understanding Market Direction (Articles Index)
Understanding Short-Term Signals
Market Direction Portfolio Trades (Members)
