Thursday saw consolidation in the market direction which is what was expected. The S&P and Dow closed lower today following yesterday’s massive rise to mark all new highs. The NASDAQ however closed up. The markets are overbought and stretched beyond support. I watched a number of analysts today on CNBC talk about this latest push being a bull trap. I don’t think that’s the case and the enormous volume they talked about is not really enormous by daily standards. Even yesterday’s volume was good but certainly not out of the ordinary. Personally I think the market direction higher is a bit ahead of itself at the moment and we could see more weakness. I’ll look at the market direction technical indicators further into this article.
Barrick Gold Stock (ABX)
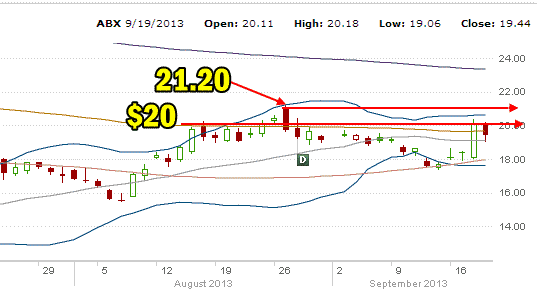
Barrick Gold Stock had an excellent move higher yesterday following the Fed announcement. But the stock still needs to break $21.20 the previous intraday high before investors can get excited about a possible rebound to $25 or even possibly $30. I received a number of emails today from investors who yesterday sold naked calls and call credit spreads. ABX Stock has pushed up to $20 which you can see in the chart below is strong resistance. The next several days may finally see the stock break through and challenge $21.20. I still think I would prefer Put Selling ABX Stock over selling naked calls. The move in gold though was probably overdone today on the back of yesterday’s Fed announcement so more weakness in gold next week and ABX Stock will probably push lower. I will be selling more puts if that happens.

Lululemon Athletica Stock (LULU)
Lulu stock finally pulled back today but it has certainly had a very nice recovery. Who would have thought the stock could move this high, getting all the way up to $74.81 on Wednesday. A lot of the move yesterday must have been short covering. Today the move lower saw the stock close at $73.50. Not bad for a stock that so many investors seem to want to hate.
Linn Energy Stock (LINE)
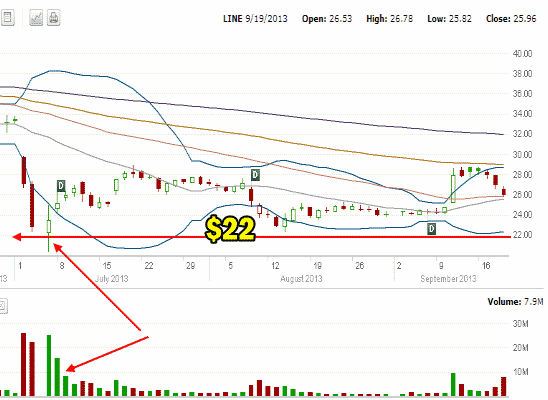
I had a lot of questions today about Linn Energy Stock following their admission of accounting practices that the SEC claim are misleading among other things. The Stock took a tumble and a lot of emails asked what I thought. Looking at the past 3 months there are a lot of investors in this stock around the $22 level. You can see this by the large volume from back in early July.

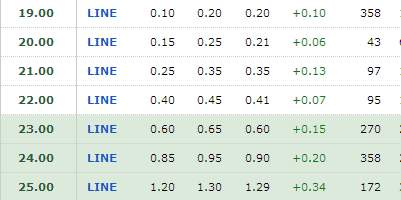
Put premiums are excellent out into Oct 19 options expiry. Below are the premiums as of the close today. I wouldn’t want to chance this stock at $22 though despite the excellent premiums. Instead I would be looking below that at $21 or $20. For the less adventurous a case could be made for a put credit spread. Perhaps selling the $22 which is support and then buying the $19 for protection. In the event things get worse at Linn Energy, and the stock falls an investor could quickly close the short side ($22) and leave the long side ($19) open to profit from further volatility in the stock.

I looked at the weeklies but I saw nothing that interested me for Put Selling. Personally I am not interested in Put Selling this stock but I can see the attraction for investors.
Advance Declines For Sep 19 2013
Today advancing issues were at 40% and declining issues held the upper hand at 57% but 525 stocks made new 52 week highs and only 113 made new lows. This continues to point to further upside momentum although many stocks are now becoming overvalued in my opinion.
Market Direction Closing For Sep 19 2013
The S&P 500 closed at 1,722.34 down 3.18. The Dow closed at 15,636.55 down 40.39. The NASDAQ closed at 3,789.38 up 5.74.
Market Direction Technical Indicators At The Close of Sep 19 2013
Let’s review the market direction technical indicators at the close of Sep 19 2013 on the S&P 500 and view the market direction outlook for Sept 20 2013.

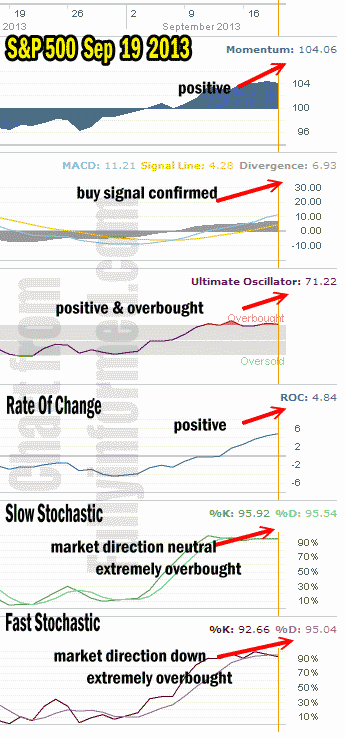
For Momentum I am using the 10 period. Momentum is positive and basically almost unchanged from yesterday. No signs of an impending large pullback here.
For MACD Histogram I am using the Fast Points set at 13, Slow Points at 26 and Smoothing at 9. MACD (Moving Averages Convergence / Divergence) issued a buy signal on Sep 9 which was confirmed on Sep 10. MACD climbed higher again today.
The Ultimate Oscillator settings are Period 1 is 5, Period 2 is 10, Period 3 is 15, Factor 1 is 4, Factor 2 is 2 and Factor 3 is 1. These are not the default settings but are the settings I use with the S&P 500 chart set for 1 to 3 months.
The Ultimate Oscillator is still very overbought.
Rate Of Change is set for a 21 period. The rate of change is continuing to climb even with today’s selling. This shows that a lot of investors were picking through stocks and buying some here and there. Most likely a lot of investors were picking up stocks that pulled back today.
For the Slow Stochastic I use the K period of 14 and D period of 3. The Slow Stochastic is signaling that the market direction is neutral. It is extremely overbought.
For the Fast Stochastic I use the K period of 20 and D period of 5. These are not default settings but settings I set for the 1 to 3 month S&P 500 chart when it is set for daily. The Fast Stochastic is extremely overbought and the signal tonight is for a down day tomorrow.
Market Direction Outlook And Strategy for Sept 20 2013
For Friday I am expected some further weakness as the market consolidates. It is also options expiry day which sometimes can surprise either way. I won’t be surprised if at the end of the day we are slightly higher.
The Fast Stochastic is signaling that tomorrow will be a down day. The Slow Stochastic is neutral which reflects the consolidation which is happening at present. Meanwhile the other indicators are all positive. In particular MACD is up higher again today, pointing to more gains ahead. The Rate Of Change is showing more investors picking up stocks. There are many overbought indicators and they have to pull back somewhat before we will see the rally move meaningfully ahead.
I am continuing to sell puts on my stocks on my watch list. Today was PepsiCo stock and JPM Stock. I am watching a few others as well.
Market Direction Internal Links
Profiting From Understanding Market Direction (Articles Index)
Understanding Short-Term Signals
Market Direction Portfolio Trades (Members)
