Taking a breather at this point is certainly to be expected. In one of the best run-ups in years the S&P 500, Dow and NASDAQ have all staged very strong recoveries although volume has remained light. The Weekly Initial Unemployment Insurance Claims disappointed this week as they will have to be adjusted since a couple of states failed to get their statistics up to date in time for this week.
The Syrian crisis seems to be settling down which means next week the focus could all be on the Fed’s two-day meeting and any possible announcement of a commencement of scaling back the $85 billion a month Quantitative Easing program now in place.
Lululemon Stock
Lulu stock ended the day down 5.4% at $65.29 sitting right at strong support. It will be interesting to see if the stock moves up and trades between $65 to $70 for a few months. I wrote an article looking at a number of strategies for Lulu stock which you can read here.
Nike Stock
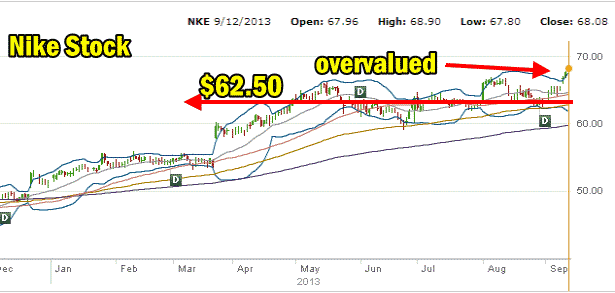
Personally I think Nike Stock is a better stock but when it comes to Put Selling, it is always best to be trading against companies that have strong definable trading patterns and enough volatility to make Put Selling out of the money puts worthwhile. Nike stock at the moment I believe is overvalued. I prefer Put Selling at the $62.50 strike which is fair value for Nike Stock. The $62.50 naked put is trading at around .54 cents making it less than 1% for October 19 options expiry. The better trade is the September 27 naked put at the $62.50 strike which is around .35 cents or the $63.50 put strike which is at .48 cents. For just two weeks of risk those returns are better and I do believe Nike Stock is stronger than Lulu Stock as well. They have a more varied product line, worldwide distributions and are a household name.

Market Direction Action for Sep 12 2013
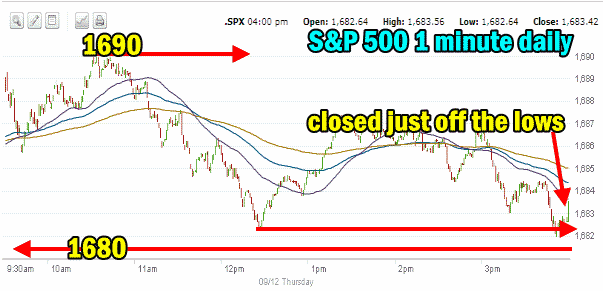
The 1 minute S&P 500 chart for today shows the market direction action. There was an attempt in the early morning to get the S&P 500 higher. At 1690 though the short rally failed and the market then pulled back down to the 1682 level. A rally in the afternoon failed and the 1682 was revisited right near the close. The S&P 500 though managed to close just off the lows for the day.
The most important aspect to take away from this chart is the 1680 level. The market direction action today reached 1682 and was within striking distance of 1680. I wrote two days ago that the break through of 1680 was too easy and I expected some testing of 1680 for support. We could see another test tomorrow in the morning.

Advance Declines For Sep 12 2013
Today was all about profit taking. Declining issues far outdistanced advancers with 65% of all stocks declining and just 32% advancing. But new highs were 192 while new lows were 124. This is part of the reason why we know today was primarily profit taking after the big run-up. Keep an eye on the advancers to make sure the new highs continue to outpace new lows. When that changes watch for the market direction up to slip.
Market Direction Closing For Sep 12 2013
The S&P 500 closed at 1,683.42 down 5.71. The Dow closed at 15,300.64 down 25.96. The NASDAQ closed at 3,715.97 down 9.04.
Market Direction Technical Indicators At The Close of Sep 12 2013
Let’s review the market direction technical indicators at the close of Sep 12 2013 on the S&P 500 and view the market direction outlook for Sept 13 2013.

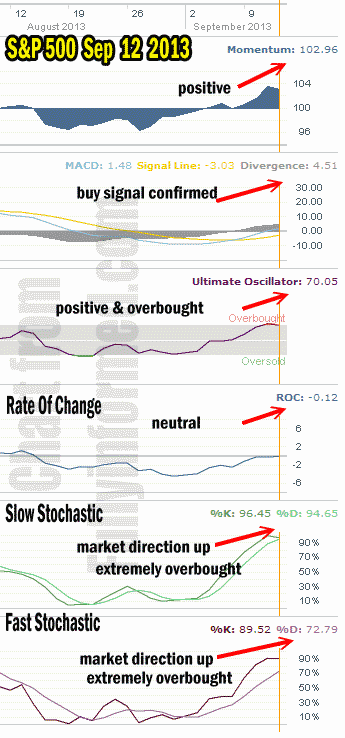
For Momentum I am using the 10 period. Momentum is positive but pulled back slightly from yesterday. This is to be expected and is not of concern at this stage of the rally.
For MACD Histogram I am using the Fast Points set at 13, Slow Points at 26 and Smoothing at 9. MACD (Moving Averages Convergence / Divergence) issued a buy signal on Sep 9 which was confirmed on Sep 10. Yesterday’s signal pointed to a sideways day for Thursday but for Friday it points to a higher close.
The Ultimate Oscillator settings are Period 1 is 5, Period 2 is 10, Period 3 is 15, Factor 1 is 4, Factor 2 is 2 and Factor 3 is 1. These are not the default settings but are the settings I use with the S&P 500 chart set for 1 to 3 months.
The Ultimate Oscillator is still overbought.
Rate Of Change is set for a 21 period. The rate of change is basically neutral again today. It cannot get higher and continues to show that investors are not pumping new money into stocks at a rate strong enough to push the market direction higher quickly.
For the Slow Stochastic I use the K period of 14 and D period of 3. The Slow Stochastic is signaling that the market direction is up but just slightly. It is extremely overbought.
For the Fast Stochastic I use the K period of 20 and D period of 5. These are not default settings but settings I set for the 1 to 3 month S&P 500 chart when it is set for daily. The Fast Stochastic is indicating that the market direction is up and it too is extremely overbought.
Market Direction Outlook And Strategy for Sept 13 2013
Today was a day of rest and consolidating. This could last another day. The Market Direction Technical Indicators are signaling that the market direction is still up but the rate of change shows a lack of conviction still exists among investors which could mean more weakness for Friday.
MACD though is signaling that the direction is still up and we should see a higher close tomorrow. The main focus of investors now should be the 1680 level on the S&P 500. If that breaks again, look for the market direction to quickly move back to 1670. I am still not concerned much about the market direction which is why I am continuing to sell puts and look for more opportunities.
For tomorrow then I won’t be surprised by morning weakness but I am expecting a slightly higher close tomorrow than today. But as the market direction is trying to consolidate here, I think any move higher will be slight until we see next week and in particular the Fed announcement.
Market Direction Internal Links
Profiting From Understanding Market Direction (Articles Index)
Understanding Short-Term Signals
Market Direction Portfolio Trades (Members)
