The market direction outlook for Friday was for the market to continue to consolidate. The overall market direction I was looking for was sideways with a bias to the upside. Amazon stock and Microsoft Stock revenue reports enthused investors in general. The better revenue from Amazon and Microsoft drew more investors into the market. One of the bigger problems starting to develop is the number of analysts and economists who are beginning to turn more bullish on not just stocks but the economic outlook in general. A few weeks ago it was people like Nouriel Roubini who is trying to shed the label of Dr. Doom for Dr. Reality. His outlook on the US economy has improved dramatically. Investors in general are also becoming more bullish with the tickersense website showing 56% of financial sites are now bullish and only 30% bearish. It is rare when market direction advances when the majority of investors are bullish.
Sectors Advancing
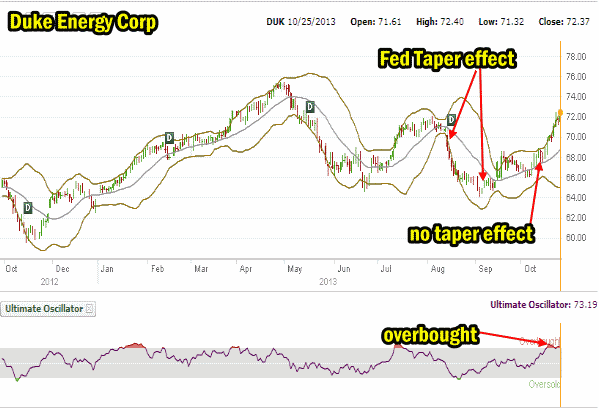
Just a little over a month ago the Fed Tapering worry pushed down interest rate sensitive stocks like Utility stocks. Since the “no tapering” outlook has come back in vogue the Utility stocks are roaring back. Duke Energy Stock (DUK) for example was up over 1% on Friday and pushing into heavily overbought territory. Put Selling over the past two months has resulted in exceptional returns.
Fortis Stock
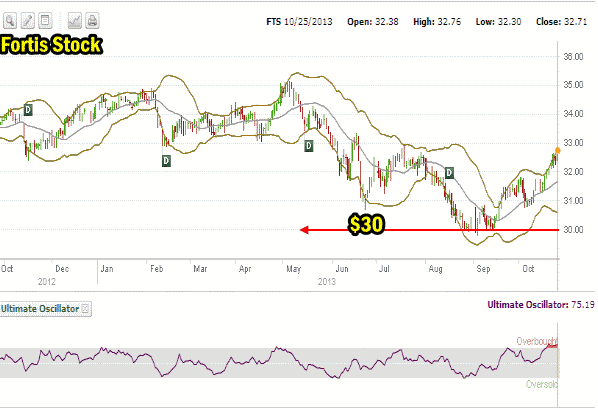
My favorite Canadian utility is Fortis Stock (FTS). It trades only on the TSX or over the counter. I have earned over 20% this year on this easy to trade stock. Every dip has been a Put Selling and stock buying opportunity. The latest was in September when the stock actually fell below $30.00 on Fed tapering fears. With the Bank of Canada, which is Canada’s central bank signaling this past week that interest rates will not be rising for probably at least another year, Fortis Stock is back above $32 and looks like it may regain the $34 level where I am holding covered calls into January 2014. This stock is also heavily overbought.
Telecommunications Sector
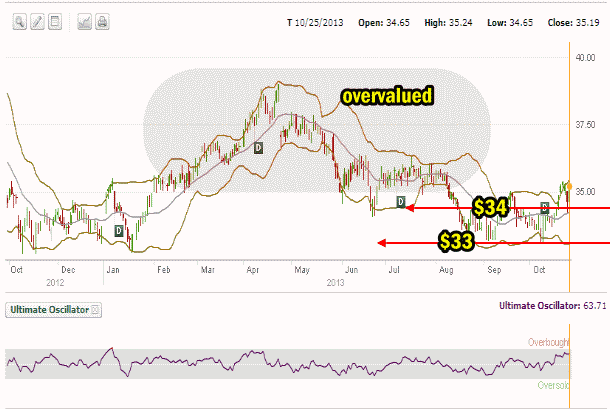
The other sector doing quite well once again is telecommunications. AT&T Stock as investors know is my favorite US telecommunications stock for Put Selling. I have done very well with the stock over the past few years but as it is reaching above $35, it is becoming overvalued. $35.00 is the last put strike I would be selling on AT&T Stock. I prefer my other two put strikes, $34 and $33. The stock is nearing overbought but still has room to move higher.
BCE Stock
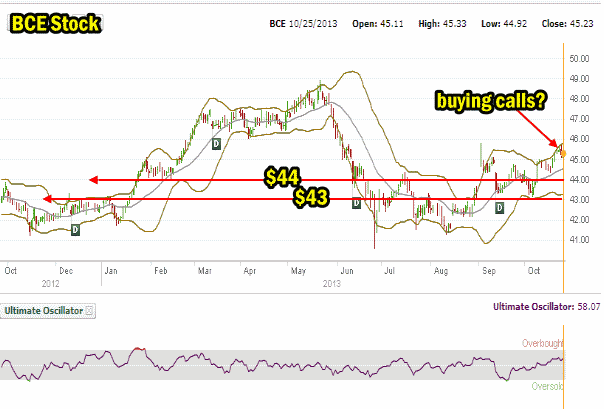
BCE Stock is my Canadian Telecommunications favorite for Put Selling and the odd stock trade here and there. If you look at the pattern of BCE Stock and AT&T Stock you can see the similarities. Both made highs early in the summer and then gave back all those highs in late summer and early fall. BCE Stock which trades under the symbol BCE on both the Toronto Stock Exchange and New York Exchange, is now pushing back up. I don’t believe it will recover the highs of $48.00 from the past spring, but you never know with investor bullish sentiment how far a stock can be pushed. The last put strike I sell is $44. Perhaps now is the time for buying call options into January 2014. This is not something I prefer but there is certainly a lot of evidence to suggest it could be a good trade. The stock is not fully overbought so there is still room to the upside.
Both of these stocks I bought shares in when they pulled back to the January lows this past late summer and early fall. Just looking at the charts I could see that the selling was overdone on both of these sectors so buying shares of Fortis Stock, Duke Stock, AT&T Stock and BCE Stock was an easy decision.
Market Direction S&P 500 Intraday For Oct 25 2013
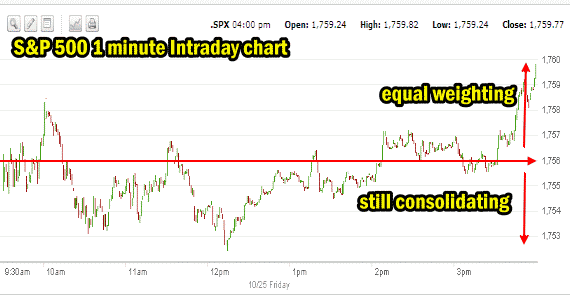
The intraday 1 minute chart for the S&P 500 for Friday below shows the sideways action with bias up I had been expecting. It also shows that once again the S&P had a late morning low which continues to make the Trading For Pennies Strategy highly profitable and simple to implement. By 3:30 the market was stuck sideways and then jumped into the close. Two things happened. The first was that the sideways action did not result in any heavy selling of any kind so traders knew that Friday was another day of consolidating. Second there was equal weighting between the upside potential and downside potential on Friday. In other words, the market direction moved up and down from the midway point which I have marked around 1756, an equal amount almost exactly. This is a sure signal that the market is consolidating and will move higher shortly.
Advance Declines For Oct 25 2013
The advance – decline ratio continues to favor advancers with advancing issues up 56% versus 41% of all issues declining. The market made 749 new highs versus 121 new lows. The market remains buoyant for investors.
Market Direction Closing For Oct 25 2013
The S&P 500 closed at 1,759.77 up 7.70. The Dow closed at 15,570.28 up 61.07. The NASDAQ closed at 3,943.36 up 14.40 and within striking distance of 4000. The IWM ETF closed up just 10 cents at $111.08 and is still signaling very overbought for the small cap stocks.
Market Direction Technical Indicators At The Close of Oct 25 2013
Let’s review the market direction technical indicators at the close of Oct 25 2013 on the S&P 500 and view the market direction outlook for Oct 28 2013.
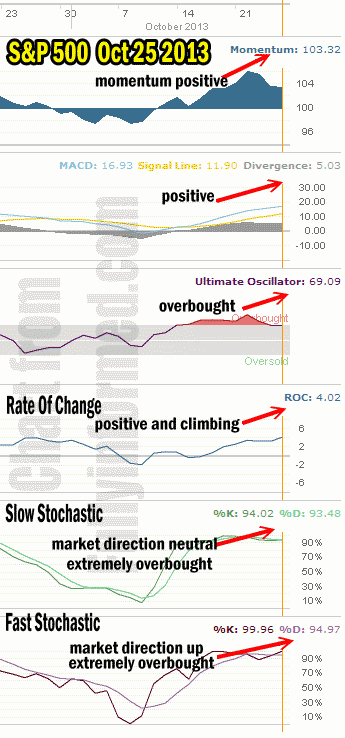
For Momentum I am using the 10 period. Momentum is very positive and flat reflecting the market direction continuing to consolidate.
For MACD Histogram I am using the Fast Points set at 13, Slow Points at 26 and Smoothing at 9. MACD (Moving Averages Convergence / Divergence) issued a buy signal on Oct 14. The signal continued strong on Friday indicating no problem for the market direction heading higher into next week.
The Ultimate Oscillator settings are Period 1 is 5, Period 2 is 10, Period 3 is 15, Factor 1 is 4, Factor 2 is 2 and Factor 3 is 1. These are not the default settings but are the settings I use with the S&P 500 chart set for 1 to 3 months.
The Ultimate Oscillator is still shows overbought but the last three days has lowered the signal somewhat and there is now room for the market direction to push back up on Monday.
Rate Of Change is set for a 21 period. The Rate Of Change is back moving higher reflecting that investors were once more buying stocks on the dips on Friday.
For the Slow Stochastic I use the K period of 14 and D period of 3. The Slow Stochastic is signaling that the market direction is up but really more neutral than up. This could be signaling that early in the week we could see more sideways action. Overall though this is a bullish sign when taken into context with the other signals. The Slow Stochastic is signaling that the market direction up is extremely overbought.
For the Fast Stochastic I use the K period of 20 and D period of 5. These are not default settings but settings I set for the 1 to 3 month S&P 500 chart when it is set for daily. The Fast Stochastic is signaling that the market direction for Monday is back to up. It remains extremely overbought.
Market Direction Outlook And Strategy for Oct 28 2013
For Monday I believe the market direction is still moving higher. While the period of consolidation has not been long enough to work out the overbought nature of the market direction, investors are continuing to buy into small dips and push stocks higher. If Monday ends up with more sideways than up action, I still think we will end up with further green to the upside. On Friday the S&P made another new all-time high. We will see more new highs this week.
I am looking for more Put Selling opportunities in my favorite stocks and I still see no signs in the market direction moving higher that concern me at the present.
Market Direction Internal Links
Profiting From Understanding Market Direction (Articles Index)
Understanding Short-Term Signals
Market Direction Portfolio Trades (Members)
