Tuesday saw the market rebound from the recent sell-off and with the NASDAQ pushing into another new high since 2000, the S&P 500 climbed back from the 1680 support level. In an impressive rally the S&P 500 climbed from 1680 and closed at 1695. Now just 5 points shy again of the 1700 level of support, investors have to wonder whether this is just another technical rebound or something more.
I think it is hope of the part of investors that the politicians will resolve the debt ceiling crisis by week’s end. If not then stocks might turn back down.
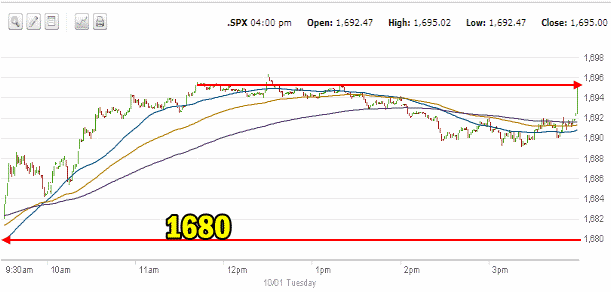
Market Direction Intraday Chart for Oct 1 2013
With support being tested throughout yesterday on the S&P 500 at 1680 as soon as buying entered the markets investors were able to move the market direction higher confident that support at 1680 will hold. You can see that the highs for the day were set in place before 12:00 and while there was some drifting lower in the afternoon, by and large the S&P held its ground and pushed higher in the last couple of minutes. Part of today’s action was also caused by the 50 day simple moving average (SMA) which the S&P flirted with yesterday. This offered investors some additional support as they pushed back from moving lower.
 NASDAQ Index Sets Another New High
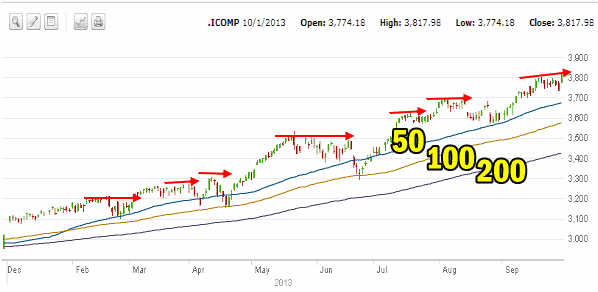
The NASDAQ has certainly had a great year moving up 726 points from the opening of trading on January 2 2013. This is a gain of 23.48% for the year! This is incredible returns. The 2013 year chart shows the continuing pattern of new highs. Many investors must be wondering how much more the NASDAQ Index can provide this year. Since the intraday low in March 2009 of 1265.52 which marked the low for the bear market, the NASDAQ has climbed an impressive 2552.46 points for a return of 201.69%. This return has caught tens of thousands of investors unprepared and many are still disappointed they listened to the doom and gloom that has surrounded this rally from the ashes of the bear market that ended in 2009.

Advance Declines For Oct 1 2013
Today was impressive for the advancing issues with 69% moving higher versus 27% of stocks moving lower. New highs were 209 versus 82 new lows. These are the types of numbers that show me that this is not just a technical rebound but a sign of underlying strength which has been with the market almost since the start of January this year. s.
Market Direction Closing For Oct 1 2013
The S&P 500 closed at 1,695.00 up 13.45. The Dow closed at 15,191.70 up 62.03. The NASDAQ closed at 3,817.98 up 46.50 and setting another new record high since 2000. The Russell 2000 ETF, IWM was up just over 1% today. Over the past several days I have mentioned that the IWM was warning to be careful trading to the downside without stops. Today those warnings came true.
Market Direction Technical Indicators At The Close of Oct 1 2013
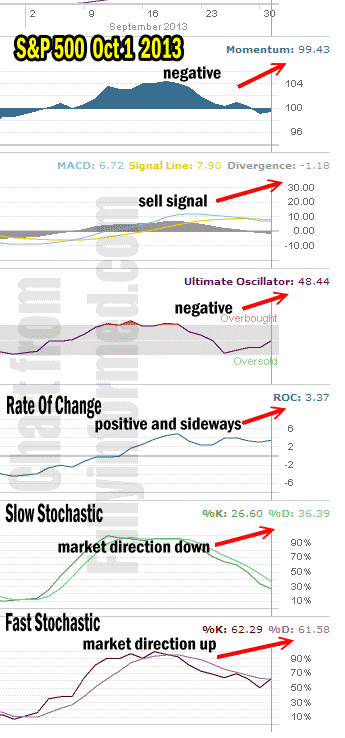
Let’s review the market direction technical indicators at the close of Oct 1 2013 on the S&P 500 and view the market direction outlook for Oct 2 2013.

For Momentum I am using the 10 period. Momentum is still negative.
For MACD Histogram I am using the Fast Points set at 13, Slow Points at 26 and Smoothing at 9. MACD (Moving Averages Convergence / Divergence) issued a sell signal on the S&P 500 on Sep 30. Today that sell signal was weakly confirmed. We need another day to know whether the sell signal is confirmed.
The Ultimate Oscillator settings are Period 1 is 5, Period 2 is 10, Period 3 is 15, Factor 1 is 4, Factor 2 is 2 and Factor 3 is 1. These are not the default settings but are the settings I use with the S&P 500 chart set for 1 to 3 months.
The Ultimate Oscillator is negative.
Rate Of Change is set for a 21 period. The rate of change is the only indicator that has remained positive throughout this latest period of weakness. It continues to show that there is a lot of interest in buying stocks. It is trending sideways today.
For the Slow Stochastic I use the K period of 14 and D period of 3. The Slow Stochastic is signaling that the market direction is down. As it looks out more than a day we could see more selling by Thursday or Friday.
For the Fast Stochastic I use the K period of 20 and D period of 5. These are not default settings but settings I set for the 1 to 3 month S&P 500 chart when it is set for daily. The Fast Stochastic is signaling that the market direction for tomorrow is back to up. The buy signal generated today remains suspect until it is confirmed.
Market Direction Outlook And Strategy for Oct 2 2013
Yesterday I indicated that I was being careful not to bet too much to the downside. Today instinct paid out over technical indicators. Tomorrow could see some further upside in the morning but depending on what the politician do, we could see a lower market into the close.
Once again my instincts tell me that a lot of investors may be in buying tomorrow after today’s nice move higher. Investors hate to think they might miss a rally and many think a rally is on the verge of coming. By today was also the first trading day of a new month and the stock markets have a history of good days for the first of the month.
For tomorrow then there are enough signs to warn that while there is some downside still to come, you should be careful placing too many bets against the market direction moving higher. Personally I think the Market Direction Technical Analysis would definitely indicate a lower day tomorrow while my instincts tell me that tomorrow we could see buying and a weak but positive close.
Market Direction Internal Links
Profiting From Understanding Market Direction (Articles Index)
Understanding Short-Term Signals
Market Direction Portfolio Trades (Members)

 NASDAQ Index Sets Another New High