The market direction outlook for Monday was sideways action with the bias lower for stocks. Much of the day stocks did remain sideways but then toward the late afternoon stocks moved higher. Let’s take a look at today’s action.
Market Direction S&P 500 Intraday For Nov 4 2013
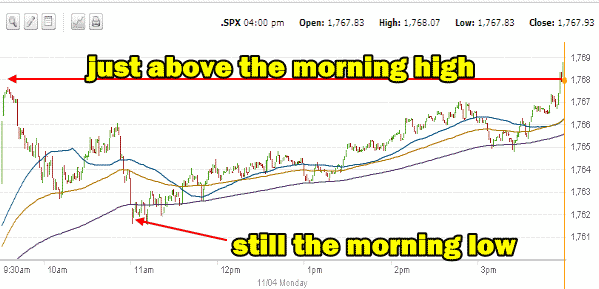
The intraday one minute chart below shows a fairly uneventful day. The morning low has returned yet again to our pattern which then set up the market for a push back higher into the afternoon. We are continuing to see this consolidation in the market direction which by now should be done. The market today closed just above the morning high and it was a fairly quiet day aside by the BlackBerry stock Plunge.

Advance Declines For Nov 4 2013
FFor the first day of the week advancers led decliner with 65% of stock moving higher and 32% lower. New highs though dropped off with just 159 stock setting new highs and 73 new lows. The consolidation is finished which is obvious from the new highs and new lows. It is time for the market direction to move up or down.
Market Direction Closing For Nov 4 2013
The S&P 500 closed at 1,767.93 up 6.29. The Dow closed at 15,639.12 up 23.57. The NASDAQ closed at 3,936.59 up 14.55. The IWM ETF had the best day with a big move back up by 1.15% to 109.97.
Market Direction Technical Indicators At The Close of Nov 4 2013
Let’s review the market direction technical indicators at the close of Nov 4 2013 on the S&P 500 and view the market direction outlook for Nov 5 2013.

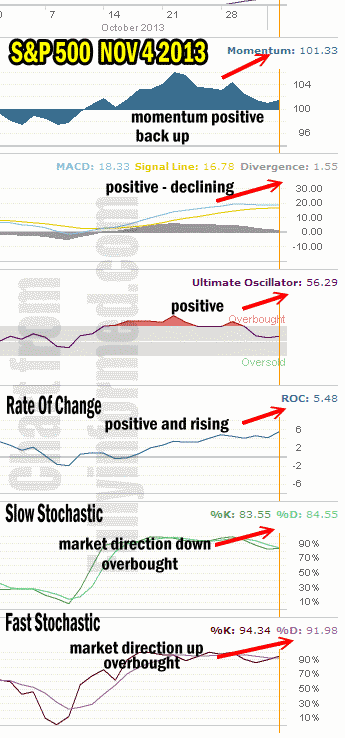
For Momentum I am using the 10 period. Momentum is still positive and moved slightly higher today.
For MACD Histogram I am using the Fast Points set at 13, Slow Points at 26 and Smoothing at 9. MACD (Moving Averages Convergence / Divergence) issued a buy signal on Oct 14. MACD has been declining since October 22. Today again MACD continued to decline.
The Ultimate Oscillator settings are Period 1 is 5, Period 2 is 10, Period 3 is 15, Factor 1 is 4, Factor 2 is 2 and Factor 3 is 1. These are not the default settings but are the settings I use with the S&P 500 chart set for 1 to 3 months.
The Ultimate Oscillator is still positive.
Rate Of Change is set for a 21 period. The Rate Of Change is moving back higher.
For the Slow Stochastic I use the K period of 14 and D period of 3. The Slow Stochastic is signaling that the market direction is down and it is overbought but the readings are close enough to be more neutral than down or up.
For the Fast Stochastic I use the K period of 20 and D period of 5. These are not default settings but settings I set for the 1 to 3 month S&P 500 chart when it is set for daily. The Fast Stochastic is signaling that the market direction is up and it is very bought again.
Market Direction Outlook And Strategy for Nov 5 2013
There is not a lot to say this evening. Tomorrow the market looks ready to try to push somewhat higher so the bias is probably shifting a bit from down to up. At this point though, the consolidation is over and the market direction must resume either an upward move or it will pull back. Friday is the unemployment numbers and they may cause a shift although it is tough to call as the government shut down will probably be reflected in those numbers.
Still though there is some strength in the market and the technical indicators show that at the close. MACD remains the concern as it continues to slip. Tomorrow could be a pivotal day for the market. The technical indicators are signaling that the direction is shifting back to up.
Market Direction Internal Links
Profiting From Understanding Market Direction (Articles Index)
Understanding Short-Term Signals
Market Direction Portfolio Trades (Members)
