The market direction at the open was certainly a bit concerning. The fear among investors of the fiscal cliff is quite high which makes them pretty jittery. They sell at a moment’s notice and buy it all back a few minutes later. Fear of being caught in the fiscal cliff is running rampant and so is fear of missing out on the end of the year rally into Christmas. Fear controls everything when it comes to the market direction and it has been like that long before I started investing.
Today is a great example. In the early morning the news on the fiscal cliff debacle scared investors and they started to sell. Then there was a lull before single family home sales figures came out and numbers were lower than anticipated at 368,000. No one seems to care that these housing figures are adjusted continuously up and down in coming weeks.
By 10:10 the Dow’s market direction was down a 100 points when news surfaced that House Speaker John Boehner (Republican) had expressed optimism that Republicans were willing to work together with Democrats to avert the fiscal cliff crisis sooner rather than later. That’s all it took for the market direction to turn around and march higher. At the close the Dow had risen 106.98 points and closed at the highs. All the indexes followed suit closing at their market direction highs for the day. For the Dow today marked a 200 plus point day. The Dow market direction was down over a 100 points and closed up over 100 points marking 200 points in recovery.
The NASDAQ is on the verge of breaking back through 3000. This in itself is very good news for tomorrow’s open. Meanwhile the S&P 500 closed up 10.99 points or 0.79% to 1409.93 and looks ready to take on the 50 period moving average.
Market Direction Technical Indicators Win Again
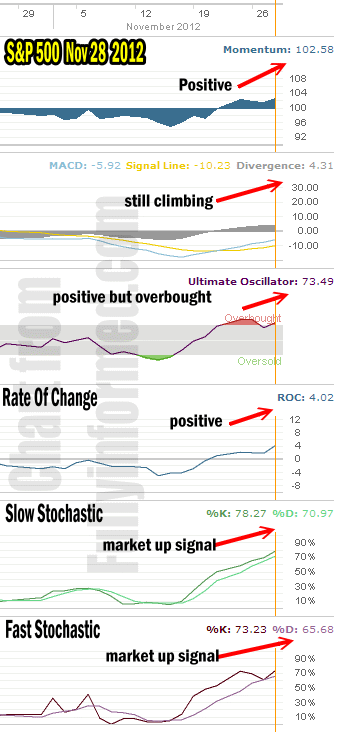
Since the weekend my market direction technical indicators have pointed to a higher market. Even with yesterday’s sell-off, they continued to insist that the market direction was still higher. The Slow Stochastic was firm in its resolve that the market direction was still up and MACD had issued a buy signal on November 21 and 23 and it too insisted that market direction was still up. So while market timing technical indicators cannot judge what the next catalyst up or down will be, they do a pretty decent job of giving confidence to continue to trade and stay in the markets. This is why I use my market direction technical indicators. It is through them that I am able to decide on how much capital to commit and when to pull that capital back. I still think this rally will push back to the 50 period moving average. Then it will be time to reassess.
Let’s review the market timing technical indicators for today to see what we can expect for market direction heading into tomorrow and possibly Friday.
Market Timing Technical Indicators For Nov 28 2012

Market Direction technical Indicator Nov 28 2012
For Momentum I am using the 10 period. Momentum is still back moving higher.
For MACD Histogram I am using the Fast Points set at 13, Slow Points at 26 and Smoothing at 9. MACD (Moving Averages Convergence / Divergence) is still moving higher and signaling that this rally will continue for the next day or two. Beyond that we have to check MACD daily.
The Ultimate Oscillator settings are Period 1 is 5, Period 2 is 10, Period 3 is 15, Factor 1 is 4, Factor 2 is 2 and Factor 3 is 1. These are not the default settings but are the settings I use with the S&P 500 chart set for 1 to 3 months.
The Ultimate Oscillator is back overbought and indicating that the market direction remains higher.
Rate Of Change is set for a 10 period. Rate Of Change is climbing higher.
For the Slow Stochastic I use the K period of 14 and D period of 3. The Slow Stochastic is now overbought but it is signaling that there is room for the market direction to push higher still.
For the Fast Stochastic I use the K period of 20 and D period of 5. These are not default settings but settings I set for the 1 to 3 month S&P 500 chart when it is set for daily. The Fast Stochastic is also overbought and is not as bullish as the Slow Stochastic but nonetheless it is signaling there is more room on the upside.
Market Direction Outlook For Nov 29 And Strategy
The see-saw market direction is bound to continue until there is a resolution on the fiscal cliff issue. It is important to stay ready to commit cash and then to pull it back. In this kind of environment I would be staying out of the money when Put Selling against any stocks I did not want to own. For those stocks I would own, I am continuing to be Put Selling on dips like this morning.
I am continuing with the Trading For Pennies Strategy daily and for those who are following the Intel Stock Bollinger Band Strategy I am still staying the course.
Market Direction then for Thursday is for the markets to push higher. As long as there is some semblance of an effort on the part of Congress and the President to work together to resolve the fiscal cliff, markets should remain reasonably calm but any hint of trouble and the market direction will change back to down. I believe Thursday and Friday will continue to be up.
Internal Market Direction Links
