The market direction outlook for Tuesday was for stocks to continue to push higher but also to exhibit problems moving beyond their respective recent highs with the S&P being held to resistance at 1800, the Dow at 16,000 and the NASDAQ at 4000. Today the NASDAQ managed to close above 4000, the first time since September 2013. Meanwhile housing pricing continued to climb slowly in September but not as fast as they did in August. Meanwhile housing starts in October were at their fastest pace in five years.
Consumer Confidence
Consumer confidence for November though came in at the lowest level in 7 months dipping to 70.4 from October’s 72.4. I though, never read much into the consumer confidence numbers. When I look back at past market pull backs and rallies the consumer confidence index had really no impact or even a part to play. In September 2008 the consumer confidence level was high and the market plunged and that is just one example.
Thanksgiving Week – Wednesday
Continuing with my statistics from the Stock Trader’s Almanac from yesterday, tomorrow is Wednesday which historically starts the rally higher in stocks which does not end until Friday of next week. It should be interesting to see how this year pans out because all the indexes are pushing hard against all-time highs and a lot of resistance.
Market Direction S&P 500 Intraday For Nov 26 2013
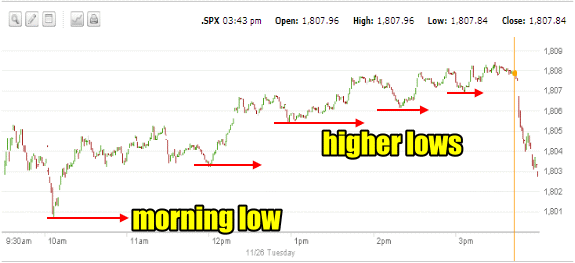
Speaking of resistance today was another fine example of selling pressure. The morning opened with stocks pushing higher. We saw the usual morning low around 10:00 which is a definite pattern for this rally. From there the market made a string of higher lows until shortly before the close when selling programs dumped a variety of stocks as obviously those fund managers I had mentioned with their year-end window dressing, felt that many stocks don’t have a lot of upside left. They sold a lot of stocks into the close. This is typical of the bigger money investors. They look for a day like today, with a steady rising trend and then wait until there is just a few minutes left in the day. They then sell in big volumes. If you look at the closing low you can see that it as still above yesterday’s close. In essence then, these fund managers are able to get out of many positions and yet the market hardly sells at all since it was already in a strong steady rise throughout the day. This is text book selling on their part and they have done this for years only now it is even easier with computer programs to assist in setting up sell prices, sell targets to stop selling at to not push specific stock prices down by much, and prices to hold stocks at.

Advance Declines For Nov 26 2013
Advancing issues outpaced declining issues today with 52% advancing versus 44% declining and 223 new highs were made versus 125 new lows. The strength is still on the side of the bulls.
Market Direction Closing For Nov 26 2013
The S&P 500 closed at 1,802.75 up just 0.27 thanks to the selling at the end. The Dow closed at 16,072.80 up just 0.26. The NASDAQ closed at 4017.75 up 23.18.
The IWM ETF closed at $112.82 after making yet another new high at $113.02 today.
Market Direction Technical Indicators At The Close of Nov 26 2013
Let’s review the market direction technical indicators at the close of Nov 26 2013 on the S&P 500 and view the market direction outlook for Nov 27 2013.

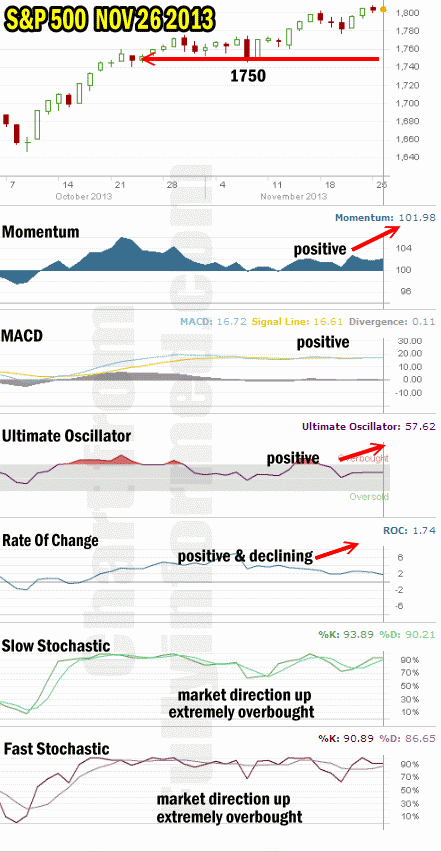
The most important support line in the S&P 500 at this time in the ongoing rally remains 1750. That support line is holding the market direction up at present.
For Momentum I am using the 10 period. Momentum is still positive but trending sideways.
For MACD Histogram I am using the Fast Points set at 13, Slow Points at 26 and Smoothing at 9. MACD (Moving Averages Convergence / Divergence) issued a weak buy signal on Nov 22 and that buy signal was given a very weak confirmation on Nov 25. Today MACD is almost neutral.
The Ultimate Oscillator settings are Period 1 is 5, Period 2 is 10, Period 3 is 15, Factor 1 is 4, Factor 2 is 2 and Factor 3 is 1. These are not the default settings but are the settings I use with the S&P 500 chart set for 1 to 3 months.
The Ultimate Oscillator is flat again today and positive..
Rate Of Change is set for a 21 period. The Rate Of Change is positive but after moving sideways yesterday it is moving lower. This indicates that buying interest for new money is not beginning to decline.
For the Slow Stochastic I use the K period of 14 and D period of 3. The Slow Stochastic is signaling that the market direction is up and it is extremely overbought.
For the Fast Stochastic I use the K period of 20 and D period of 5. These are not default settings but settings I set for the 1 to 3 month S&P 500 chart when it is set for daily. The Fast Stochastic is signaling that the market direction is up and it is extremely overbought.
Market Direction Outlook And Strategy for Nov 27 2013
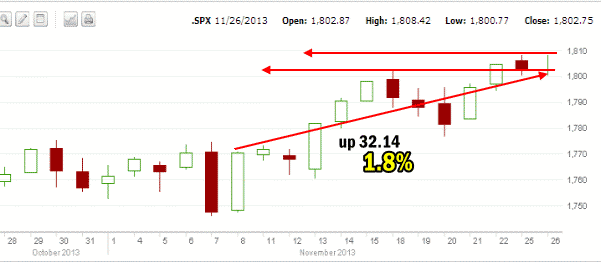
While the market direction technical indicators are all in agreement that the market direction is up there are a number of signs that need to be heeded. The first is that over the past 13 trading days the market direction higher has only returned 1.8%. While a decent return, it is not comparable to earlier gains and continues to show hesitancy on the part of investors. The second sign in the chart is the closing today which again puts the S&P in line with two prior closings, both of which saw selling into the close. You can see that fund managers and biggest traders are taking profits while at the same time talking up the market. In other words they are lightening their load to to speak. This is most like because they believe further gains will not warrant risking as much capital as they presently have in the market. By reducing their amount of capital they can also take advantage of any weakness in December and perhaps pick up another percentage or two during the usual Santa Claus rally at the year end.

MACD and Technical Indicators
MACD is trending sideways and if you look at the readings from the Fast Stochastic, Slow Stochastic, Ultimate Oscillator, and Rate Of Change you can see that the market direction while slowly creeping higher is actually trending sideways. This is ideal for big traders and fund managers. They picked up stocks earlier this fall and now have the ideal environment to begin to unload shares. With stocks hanging tough and only dipping slightly during the selling, fund managers can unload shares and with all the talk about the market continuing to move higher, it is easier to keep stock prices steady.
Coca Cola Stock Example
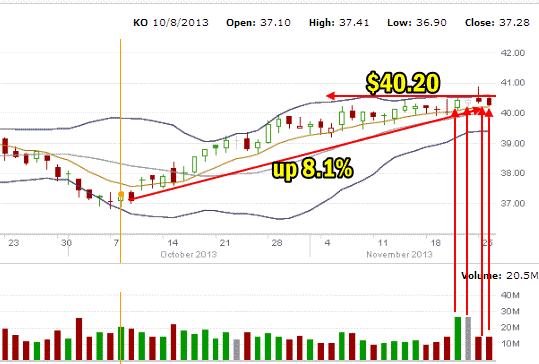
There are dozens upon dozens of examples. Coca Cola Stock is a good example. Back at the start of October, the stock could be bought for around $37. Now up 8%, the rise has slowed considerably, but note how we have seen two big volume days, larger than any volume days in months. Then two more average volume days, both of which saw more selling pressure than buying pressure, yet the stock is steady.
If you look at the past 4 days and consider the dollar amounts you can begin to understand better what large fund managers are able to accomplish. On Nov 21 for example, 26.4 million shares traded hands. If we take an average price of $40, the total amount of capital that day was $1.04 billion. The next day Nov 22 26.4 million shares again were traded and $1.04 billion again traded hands. Then on Nov 25 and Nov 26, 14.1 million and 14.2 million shares traded and again if we take an average price of $40 a share, the total capital is $560 million each day. Therefore over the course of 4 trading days over $3 billion dollars was traded in Coca Cola Stock. Take that example and multiply by 30 or 40 stocks and you can begin to understand how fund managers can boost their overall portfolios by a few percentage points into the year-end. They have the capital to be able to do this while the small investor does not.
This is perfect for the big money fund managers. It is a large cap blue chip stock which is excellent in their portfolios and they can pump in hundreds of millions, not thousands and earn 8% in just over a month and a half. That will certainly help boost the annual returns I talked about in the year-end window dressing article.

Outlook For Wednesday
While the technical indicators all point to another attempt at a higher high tomorrow, you can see that resistance is tough to overcome as sellers are carefully reducing positions and taking profits. This does not mean the market direction will not continue higher in December, but it does tell us that bigger investors who have more financial information that the small investor does, are taking some profits and obviously believe while there may be more upside, it could be limited as we head into December.
Tomorrow then everything looks set for another attempt to move higher and Wednesday of Thanksgiving week historically begins the Thanksgiving rally. We will have to wait and see if this is also the case this year. Right now though a lot of big money is betting that it is time to lighten positions going into December. They are definitely starting to move to the sidelines as we head into the year-end. So while many like UBS are talking up the market, the volumes don’t agree and this is an age old tradition of talk up stocks to keep them up while reducing positions and taking profits. Remember that the stock market is small in relation to bonds, currencies and most commodities and for that reason alone, manipulation is easier in stocks.
Market Direction Internal Links
Profiting From Understanding Market Direction (Articles Index)
Understanding Short-Term Signals
Market Direction Portfolio Trades (Members)
Market Direction External Links
Market Direction IWM ETF Russell 2000 Fund Info
Market Direction SPY ETF 500 Fund Info
