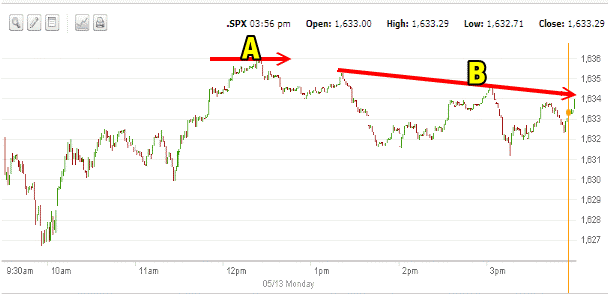
My Market Direction outlook for Monday was pretty much what the market direction followed. The markets opened up and followed through on Friday’s close moving higher by the end of the morning but then the S&P 500 turned down and drifted sideways managing to squeak out a very small gain of just 0.07 points. The retail numbers came in slightly higher than expected but not really surprising the market as overall the numbers were simply “OK”. This provided enough strength though to curtail any heavy selling. Investors are stubbornly holding their positions here but any kind of serious setback and there will be selling. Investors can put on a “brave face”, but just the hint that others want out and the crowd will sell shares. Still though I see nothing more than shallow selling at this point in the rally.
Market Direction Action For May 13 2013
Here’s today’s market direction action. The market opened, dropped a little and then spent the rest of the morning pushing to the daily high which I have marked as Point A. The overbought nature of the market is holding the market direction higher, back and the afternoon was spent as you can see in Point B with the market drifting more sideways than down.

During the day precious metals continued to decline but despite all the gloom with gold, the yellow metalwas down just $2.30 an ounce to $1434.30. Crude oil meanwhile was down 87 cents to $95.17 a barrel but it still has a ways to fall before it reached $90.
Market Direction Economic News For The Week
Just to recap, these are the conomic reports that could impact the market direction this week. So far we have had the latest retail sales and they were up just 0.1 percent but then analysts were calling for a contraction of 0.3 percent after March’s contraction of 0.5 percent.
- Monday we get the latest retail sales.
- Wednesday we get producer prices and industrial production.
- Thursday is consumer prices and housing starts
- Friday is leading indicators.
Market Direction Closing For May 13 2013
The S&P 500 closed at 1,633.77 up 0.07 points. The Dow closed at 15,091.68 down 26.81 points. The NASDAQ closed at 3,438.79 up 2.21 points.
Market Direction Technical Indicators At The Close of May 13 2013
Let’s take a moment now and review the market direction technical indicators at the close of May 13 2013 on the S&P 500 and view the market direction outlook for May 14 2013.

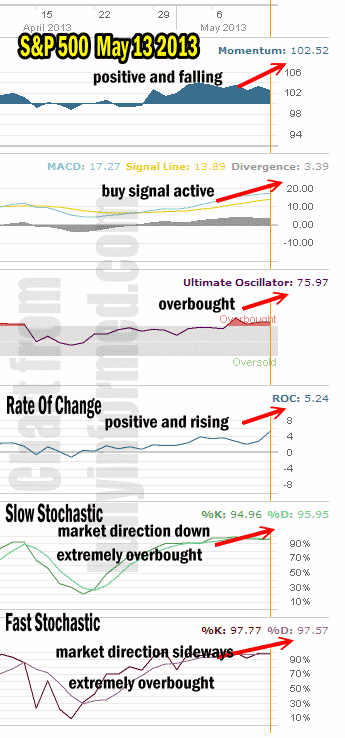
For Momentum I am using the 10 period. Momentum is positive and back falling again. It has continued to fail to reach the strength of early last week.
For MACD Histogram I am using the Fast Points set at 13, Slow Points at 26 and Smoothing at 9. MACD (Moving Averages Convergence / Divergence) issued a buy signal on April 26 and the signal remains valid. The signal reading though is lower today than on the past two days indicating the move is still up but the market direction is so heavily overbought that a pull back could occur at any time.
The Ultimate Oscillator settings are Period 1 is 5, Period 2 is 10, Period 3 is 15, Factor 1 is 4, Factor 2 is 2 and Factor 3 is 1. These are not the default settings but are the settings I use with the S&P 500 chart set for 1 to 3 months.
The Ultimate Oscillator is extremely overbought and is still signaling that a change in market direction to down is needed for the overbought condition to be worked out before stocks can move meaningfully higher.
Rate Of Change is set for a 21 period. Rate Of Change is pushed a lot higher today showing a lot of activity among investors. Often this type of jump higher in an overbought market signals an end to a move and a change in trend to lower.
For the Slow Stochastic I use the K period of 14 and D period of 3. The Slow Stochastic is extremely overbought and is signaling that the market direction is down. Since the Slow Stochastic looks out longer than a single day we could see some selling early to mid-week.
For the Fast Stochastic I use the K period of 20 and D period of 5. These are not default settings but settings I set for the 1 to 3 month S&P 500 chart when it is set for daily. The Fast Stochastic is also extremely overbought and is now signaling that the market direction is sideways to down.
Market Direction Outlook And Strategy for May 14 2013
I did not do trades today as the market direction primarily is shifting sideways while the market decides whether it will work out the overbought condition by churning sideways or whether it will fall lower to work out this overbought condition.
I don’t see any reason to place my capital at work here unless some of my favorite stocks take a bit of a tumble. There could be more selling by mid-week which could push stocks lower and put premiums higher. Often in this rally when the markets have drifted sideways for a couple of days, the market direction has suddenly shifted back to up and that could very well happen here again. However right now the market direction technical indicators are all pointing to more sideways action with the bias definitely to being lower.
Tomorrow then I expect to see the market direction continue to drag sideways with the bias to be lower near the close. I see nothing but a shallow dip though so I will be looking for any opportunity to sell puts should some of my favorite stocks drop intraday.
Internal Market Direction Links
Profiting From Understanding Market Direction (Articles Index)
Understanding Short-Term Signals
Market Direction Portfolio Trades (Members)
Market Direction External Links
