As we prepare to start into march Market Direction often for March is mixed. February tends to be the weakest of the best 6 months and by the end of the month the market direction hung on to close up. Often March starts poorly and then builds momentum in the middle of the month only to experience weakness towards the end of the month which often sets up April to be much stronger. In recent years March at times has been turbulent.
in 2009 March marked the bottom of the 2008-09 bear market. In 2010 the S&P gains 5.8% in March. In 2011 March gained just 2.1% and in 2012 March gained 2.8%. I am not expecting big gains in March and with the budget cuts now in place in the US and both sides of the budget battle pointing fingers like kids in a sandbox March could end up being a lot more turbulent than February.
Market Direction for February Revisited
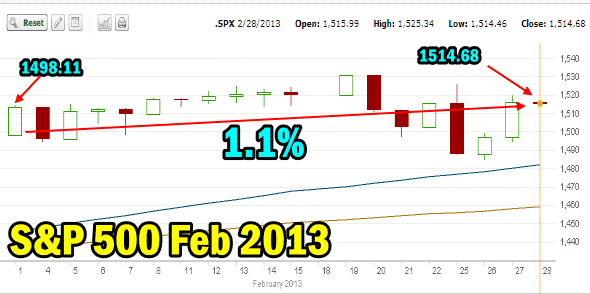
The market direction for the month of February was sideways although as Sam Stovall indicated the market direction was still up and historically we have never had a down year since 1942 when February was up no matter how small the gain was.

S&P 500 Market Direction Feb 2013
Throughout the entire month my market direction technical indicators were basically warning of a sideways momentum to the market direction. They also signaled that the downside was limited but also the upside. It was a pretty perfect month for Put Selling and all variety of trades were successful so overall while market direction may not have moved much, many stocks did move and returns on many stocks ended up quite decent.
I think the most important information to take from the market direction technical indicators from the daily readings I discussed each night is how for the entire month they kept me invested but cautious. I believe this was the best way to invest in February and it certainly paid off as returns are coming in better than 1% a month with very little to worry about with my list of stocks I am invested in.
Market Direction Closings
Market direction closings for Friday were all positive. The S&P 500 closed at 1518.20, up 3.52 points and the Dow closed at 14089.55, up 35.17 points. The NASDAQ closed at 3169.74 up 9.55 points.
Market Direction Technical Indicators At The Close of Mar 01 2013
Let’s take a moment now and review the market direction technical indicators at Friday’s close on the S&P 500 and view the outlook to start the week.

Market Direction Technical Analysis for Mar 01 2013
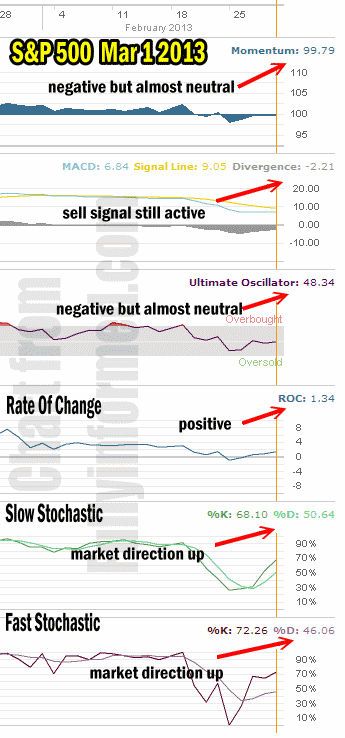
For Momentum I am using the 10 period. Momentum is still flat and still reflects a sideways action to the market as the readings on Thursday and Friday were basically neutral.
For MACD Histogram I am using the Fast Points set at 13, Slow Points at 26 and Smoothing at 9. MACD (Moving Averages Convergence / Divergence) is still negative and has been so for almost the entire month of February. Anyone who followed the MACD sell signals at the start of February basically would have been protected from a sideways action. MACD then has been decent to follow. On Friday MACD indicated that the market direction is still negative but the reading is rising albeit slowly.
The Ultimate Oscillator settings are Period 1 is 5, Period 2 is 10, Period 3 is 15, Factor 1 is 4, Factor 2 is 2 and Factor 3 is 1. These are not the default settings but are the settings I use with the S&P 500 chart set for 1 to 3 months.
The Ultimate Oscillator is still negative but at 48.34 it is closer to neutral than negative.
Rate Of Change is set for a 21 period. Rate Of Change is still positive and it back climbing.
For the Slow Stochastic I use the K period of 14 and D period of 3. The Slow Stochastic is signaling that the market direction remains up and this week should see higher valuations in the S&P than last week.
For the Fast Stochastic I use the K period of 20 and D period of 5. These are not default settings but settings I set for the 1 to 3 month S&P 500 chart when it is set for daily. The Fast Stochastic is confirming the Slow Stochastic. The Fast Stochastic tends to look out just one day while the Slow Stochastic is used to predict further than a day or two. The Fast Stochastic is signaling that Monday will see the market direction continue to push higher.
Market Direction Outlook And Strategy for Mar 04 2013
The consensus among the Market Direction Technical Analysis indicators is once again a split. Three Technical Analysis indicators are pointing to a higher day on Monday and three are pointing to a neutral to down day. Note how often we have seen this picture presented by the technical timing tools, but what is important is how these tools are still signaling that nothing dramatic is about to happen. The market could drift lower but there are no indications of any big drop ahead.
The market direction outlook to start March then is exactly the same as February ended – namely sideways action with a slight bias to the upside. My strategy then remains unchanged at still cautiously selling puts, doing the odd stock trade and taking smaller positions and closing at the first sign of a good profit or of trouble developing. Thanks to the market direction technical indicators for the entire month of February I stayed invested and continued to compound my portfolio.
There are lots of problems ahead but then there always are. The inability of the President and Congress to work out a budget deal is disappointing and the payroll tax increases implemented earlier this year have made a dent in earnings, particularly at retail levels. It will be interesting to see what the sales stats will be like for autos going forward and whether the market direction can continue to climb.
There was a lot of talk on CNBC on Friday that this market climb is nothing more than a bear trap. I don’t see that but as I primarily sell puts, should something unforeseen develop there will still be time to move to the side and to put in place my Spy Put Options trade to benefit from any market direction move lower.
Right now though the belief that this is a bear market trap I think is unfounded. If earnings begin to decline next quarter that could signal a pull back but it should also signal a move higher in volatility which means my VIX Index Strategy trade should perform well.
There is always a strategy to use to profit from market direction, up down or sideways. The key is to stay prepared but not to allow any worry about the market direction and let it erode your confidence in taking trades. It is simple a case of just watching market direction, being aware of warning signs but also looking for profit opportunities along the way. This is how I can continue to stay invested, compound my capital and earn income.
Internal Market Direction Links
Profiting From Understanding Market Direction (Articles Index)
Understanding Short-Term Signals
Market Direction Candlestick Daily View (Members only)
Market Direction Portfolio Ongoing Trades (Members only)
Market Direction External Links
