The market direction on Friday was for a down market after a rally attempt. There were actually two small rally attempts that mounted to not much and the afternoon was a drift lower. Analysts have tried to pinpoint the reason for the sell-off on Thursday and then the drift lower on Friday but there were no real answers. The biggest concern was most likely the Ukraine and Crimea. Now that the vote is finished over the weekend, analysts are downplaying the results impact to the markets. In general they doubt stocks will head much lower. They could be right, but they could also be wrong. Political events can always take a turn unexpected and while analysts believe Russia will simply scoop up the Crimea because of the weekend vote, investors will most likely be nervous to start off the week.
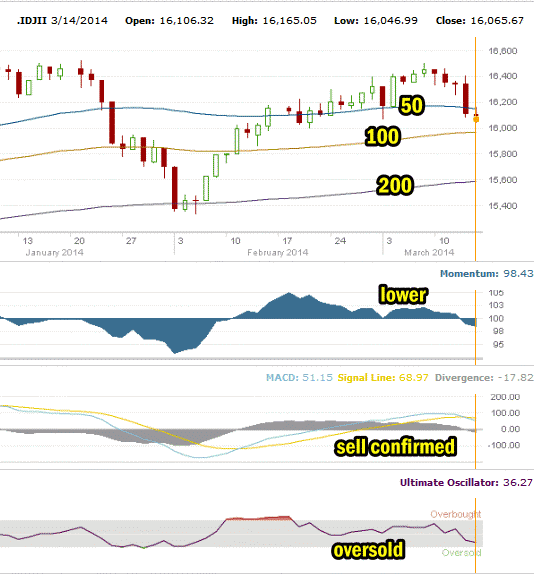
Dow Market Direction March 14 2014
There are other issues as well. The Dow broke good support at 16200 and is now heading back to what has been a very tough valuation, namely 16000. That level has posed a major problem for the Dow for months. As well as breaking support, the Dow also broke the 50 day simple moving average (SMA) on Thursday and on Friday continued to move below it. While this could just be a blip and the Dow comes roaring back, I don’t see it as quite so easy. Momentum is continuing to move lower and MACD issued a sell signal on Thursday and confirmed that signal on Friday. Meanwhile the Ultimate Oscillator is oversold but not extreme so there is still room to fall. The catalyst that the market might need though, could come this week from Fed Chairman Janet Yellen. You just never know what the Fed may be considering doing. They certainly won’t want to be seen as possibly moving a bit too early on further tapering and you never know what she could announce or say. That could be the catalyst back up.

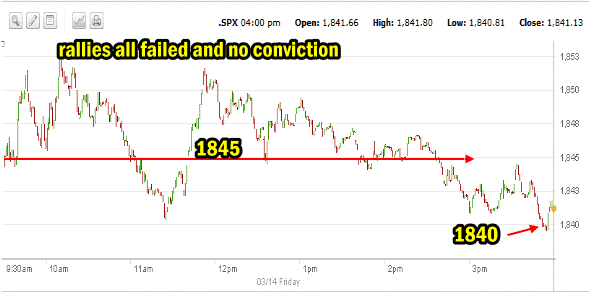
S&P Market Direction Intraday for March 14 2014
The one minute intraday S&P chart below shows the action on Friday. Rallies were really non-events. There was little conviction in the buying as you will see in the rate of change indicator. The 1845 level held for a while during the day but into the close the market fell back once more to test the support of the 1840 level. There was a small rebound off of it but nothing that would indicate Monday will not see further tests and possibly even an attempt to break lower. All in all, Friday did not look overly convincing that we have seen the low in this little pullback.

Advance Declines For March 14 2014
Advancing issues outpaced declining issues with 56% of stocks advancing and 41% declining. New lows came in at 90 while new highs were just 63, but the new lows were not overly suggestive that investors are worried yet. Normally if this was a serious correction the new lows would be outstripping the new highs 2 to 1 at a minimum.
Market Direction Closings For March 14 2014
The S&P closed at 1841.13 down 5.21. This was not a big move down but the lack of any major rally attempt was somewhat disheartening and the retest of the 1840 support level at the close was also disappointing to see. The Dow closed at 16,065.67 down 43.22 and well within striking distance of breaking 16000. The NASDAQ closed at 4245.40 down 15.02 although some tech stocks looked better than others and Apple Stock fell to 523 intraday. I obviously did my double dip put credit spread one day too early having rolled it on Thursday.
The Russell 2000 ETF IWM closed up almost half a percent on the day at $117.54 which was nice to see and brings a bit of hope that if the small caps hang on here, the sell-off might turn around.
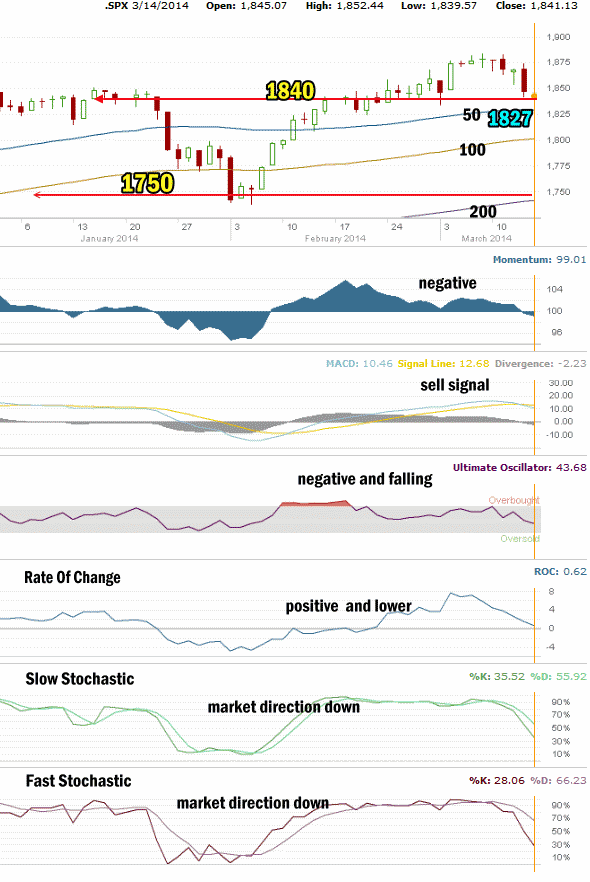
Market Direction Technical Indicators At The Close of March 14 2014
Let’s review the market direction technical indicators at the close of March 14 2014 on the S&P 500 and view the market direction outlook for March 17 2014.

The 1750 level is holding the S&P up. The 1840 is now the first line of support against any a pullback. On Friday stocks pressured the 1840 level late in the day. While disappointing, it was not surprising as there was no real buying interest from investors heading into the weekend.
For Momentum I am using the 10 period. Momentum has been the best indicator over the past two months, replacing MACD as the most accurate indicator. Momentum fell further on Friday and is negative.
For MACD Histogram I am using the Fast Points set at 13, Slow Points at 26 and Smoothing at 9. MACD (Moving Averages Convergence / Divergence) issued a sell signal on Feb 13. MACD continued to decline on Friday and easily confirmed the sell signal with a lower signal on Friday.
The Ultimate Oscillator settings are Period 1 is 5, Period 2 is 10, Period 3 is 15, Factor 1 is 4, Factor 2 is 2 and Factor 3 is 1. These are not the default settings but are the settings I use with the S&P 500 chart set for 1 to 3 months.
The Ultimate Oscillator is negative and falling lower but it not near being oversold unlike the Dow..
Rate Of Change is set for a 21 period. The rate of change is still managing to hang onto a positive reading but when you look at the chart for the Rate Of Change you can see that buying interest has been falling daily for a while now.
For the Slow Stochastic I use the K period of 14 and D period of 3. The Slow Stochastic is signaling that the market direction is down again and as it looks out more than a day, we could be seeing lower prices to start off the week and into Tuesday.
For the Fast Stochastic I use the K period of 20 and D period of 5. These are not default settings but settings I set for the 1 to 3 month S&P 500 chart when it is set for daily. The Fast Stochastic is signaling that the market direction is down fairly big again for Monday. It is though reaching oversold status and that could assist in bringing in a few bargain hunting investors.
Market Direction Outlook And Strategy for March 17 2014
For St Patrick’s Day on Monday the market direction looks set to continue to move lower. The mood is not really anxious but certainly nervous. A lot of investors are wondering what happened to the market here. A lot of capital has flowed into stocks to start the year off but they have moved in the opposite direction. This is what makes investing though, emotions. While the technical timing tools can try to gauge investor sentiment, momentum, and even the mood, that can change quickly. Overall though it is more likely that the Ukrainian crisis and the Chinese data showing a slowdown are all that some investors were looking for to take profits. There really is no big panic. Thursday’s big down day was not followed by a big up day, which is true, but it was not followed by another big down day either. Investors on Friday were taking a wait and see approach once again. Most investors still seem connected to the market at this point and while the mood has changed somewhat, most seem to feel that this is just a small blip before stocks move back up.
The technical indicators though are not saying that will be the case. All of them point to lower valuations ahead for stocks. On Friday, those who followed my Twitter posts know that I did a lot of Spy Put Options trades on Friday. I have not had time yet to up date my trades but I hope to later tonight or into tomorrow. I did that many twitter posts in the hopes that investors following got a feel for getting in, setting up positions, watching for entries and exits as well as taking profits and not being too concerned if the market moved lower after I had sold out. That kind of twitter posting though is not the easiest to do and post to the website and do my other trades. I got a fill on a Johnson and Johnson Stock naked put for April 19 expiry but I could have got a better price had I noticed to move my offer a bit higher. Still though it was a wonderful experience and I received a lot of emails thanking me in return. A lot of investors told me it was a great learning experience.
Tomorrow then still looks weak and with 1840 set to be tested for the S&P and 16000 looming for the Dow, I will be trading with an eye on the downside. That said this is a bull market and when some stocks sell lower, I have to take advantage of the premiums. For members, I will have up a list of some of the stocks I am watching for early next week, later tonight. The market direction is down for Monday but remember, the markets could surprise either way as two catalysts should show us which way stocks will move next – the Crimea and the Federal Reserve.
Market Direction Internal Links
Profiting From Understanding Market Direction (Articles Index)
Understanding Short-Term Signals
Market Direction Portfolio Trades (Members)
Market Direction External Links
Market Direction IWM ETF Russell 2000 Fund Info
Market Direction SPY ETF 500 Fund Info
