Market Direction last week was pretty well a whipsaw action. It reminded me of that line from Shakespeare’s Macbeth “full of sound and fury, signifying nothing” for the market direction in the S&P 500 opened on Monday at 1560.70, dropped immediately to 1545.43 and closed the week at 1556.89. This week though is pivotal as the final week in March often sets the tone for April which is often one of the better months for stocks.
Depending on your “half glass full or half empty” stance on the market direction, either the market the week ended up by about 11 points if you take Monday’s opening drop as the start for the week or you take Monday’s morning open and say the market dropped 3.81 points for the week. Essentially no matter how you look at the market direction it was flat “lots of spills and chills” but going nowhere fast.
This kind of market direction action is tough for the market direction technical indicators to predict with a great deal of certainty because there are more factors to take into account than just the market direction movements itself. Europe was back in the picture and despite the size of Cyprus, both geo and economic, what is going on there could have far-reaching repercussions for much of Europe. I would hate to see such insanity prevail on this side of the Atlantic. Imagine, for the first time in over a century it actually would be wiser to have your money stuffed in a mattress at home! I cannot imagine taxing bank accounts, but you know just about everything else is taxed so perhaps that day is coming. To be fair though, if Germany came up with the idea, perhaps then Germany should start it at home as well. It would be interesting to see how their own citizens react.
I think the last thing to say has to be this only goes to show how far politicians will go to get re-elected. The news that Germany’s first female Chancellor Angela Merkel pushed for this taxing of savers as a way to improve her chances of being re-elected with German voters is certainly a sad statement on the lengths political figures will go to, to stay in power. Anyway, enough on that.
Market Direction Action For Two Weeks
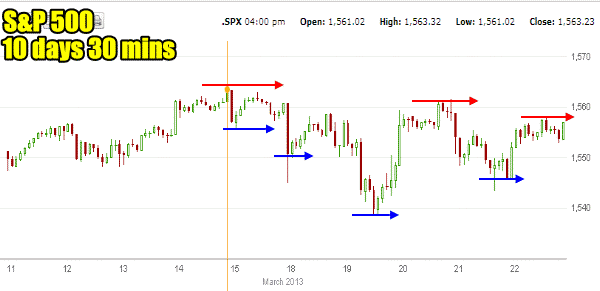
Chart 1: S&P 500 Market Direction 10 days
A couple of Market Direction charts I want to show. The first one below is of the S&P 500 market direction for the past 10 trading days (2 weeks) set for 30 minutes. The market direction high of 1563.23 closing on March 15 has so far marked the highest level in the S&P 500 in the present rally since January. What we are seeing though is a pattern of lower highs developing. The opposing pattern of lower lows was broken late this week so this could be nothing, but it is something worth keeping an eye on. This pattern often precludes the beginning of a more serious pullback. I am not saying there will be more weakness ahead but as an investor it is always worth paying attention to such patterns when they start to develop.

Market Direction over the past 10 days on the S&P 500 - 10 minute chart
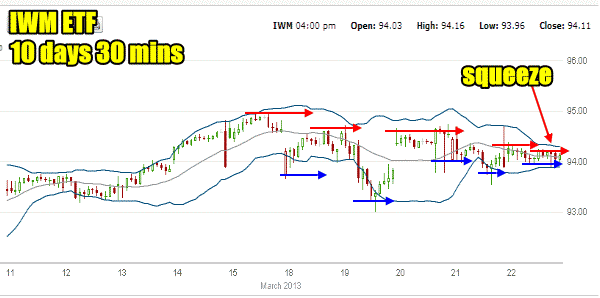
Chart 2: IWM ETF (Russell 2000) Market Direction 10 days
The second chart to review is the IWM ETF. This chart is always important as it represents the cream of the small-cap stocks containing 2000 of the best small-cap stocks in the market place. It is always worthwhile watching the IWM as often it can warn of an underlying current in the market direction.
The past 10 days trading is producing a chart not unlike the S&P 500 although it is not quite as bearish with the lower lows. Lower highs though are prevalent and easy to spot. However the most interesting aspect of the IWM at present is the Bollinger Bands Squeeze. FullyInformed Members should know this well as I have written about the Bollinger Bands Squeeze many times in the past. The Squeeze is important as it signifies a coming end to the sideways movement. In more than 50% of cases the squeeze ends in a downturn. But with indices it is different. The Bollinger Bands Squeeze on the IWM is almost equally weighted to up and down breakouts.

Market Direction of the IWM for 10 days - 30 minute time frame
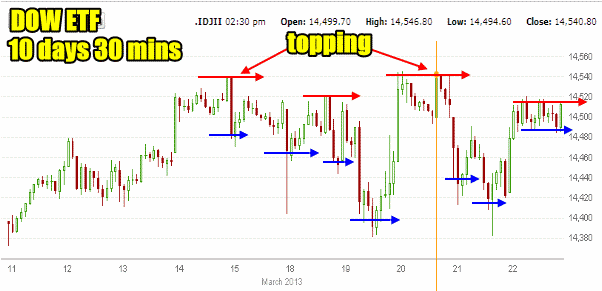
Chart 3: Dow Jones Market Direction 10 days
The final chart I want to look at is the Dow Jones Index. The Dow led the markets higher in January. Since then the Dow has turned sideways and twice in the past 10 days it made new highs. Often these highs can become problematic. The Dow too is exhibiting a pattern of lower highs and lower lows but it is not as dominant as in the above two indexes. As well the Dow is showing good strength but this coming week it needs to move higher, otherwise the market direction could be setting up for a more serious pullback. Before analyzing further let’s look at the S&P 500 market direction technical indicators for Friday.

Dow Jones Market Direction for the past 10 days - 30 minute time frame
Market Direction Closings
The S&P 500 closed at 1556.89 up 11.09 points and the Dow closed at 14,512.03 up 90.54 points. The NASDAQ closed at 3245.00 up 22.40 points.
Market Direction Technical Indicators At The Close of Mar 22 2013
Let’s take a moment now and review the market direction technical indicators at Friday’s close on the S&P 500 and view Monday’s outlook.

For Momentum I am using the 10 period. Momentum is still positive but despite the big move higher on Friday momentum is still at the point of turning negative if there is even some selling on Monday.
For MACD Histogram I am using the Fast Points set at 13, Slow Points at 26 and Smoothing at 9. MACD (Moving Averages Convergence / Divergence) is still negative. On Thursday it issued a sell signal and on Friday despite the push higher, the sell signal is active and MACD is reading more negative than Thursday. Basically the market direction up on Friday was not confirmed by MACD.
The Ultimate Oscillator settings are Period 1 is 5, Period 2 is 10, Period 3 is 15, Factor 1 is 4, Factor 2 is 2 and Factor 3 is 1. These are not the default settings but are the settings I use with the S&P 500 chart set for 1 to 3 months.
The Ultimate Oscillator is still positive but it too was not convinced by the market direction move higher on Friday. The reading is only slightly improved.
Rate Of Change is set for a 21 period. Rate Of Change is still positive but it was also not impressed with Friday’s action. The rate of change is still signaling that among investors anyway, their outlook is not really changed. Friday’s rally then may not be carried through on Monday.
For the Slow Stochastic I use the K period of 14 and D period of 3. The Slow Stochastic is decidedly neutral despite Friday’s rally. Further, the market direction move up on Friday did not confirm the buy signal from Thursday which the slow stochastic had signal. Therefore this negates the buy signal from the Slow Stochastic.
For the Fast Stochastic I use the K period of 20 and D period of 5. These are not default settings but settings I set for the 1 to 3 month S&P 500 chart when it is set for daily. The Fast Stochastic is extremely overbought and it is indicating that Monday the market direction will be higher. As well, the Fast Stochastic is indicating that the buy signal from Thursday was confirmed on Friday.
Market Direction Outlook And Strategy for Mar 25 2013 – Pivotal Week
The market direction outlook for Monday is not as rosy as you would think after Friday’s market direction push higher. There are a lot of warning signs still in the market direction. I am moving back to a more cautious stance on the market and I will be looking for only the better opportunities to be Put Selling. If IWM pushes higher out of the envelope and can hold beyond the Bollinger Bands Squeeze to the upside then I will continue to put more capital at work.
The Dow though is a bit of concern as well. The two topping days needs to be broken and hopefully this week. Meanwhile though we are almost through March and April tends to be a better month for the market direction. This week could set the markets up for a push higher in April. I have been careful not to place too many naked puts into the month of May as this could be one of those years when May needs to sold in keeping with the adage, “Sell in May and go away”.
Meanwhile the market direction technical indicators for Friday found the rally unimpressive and most of the indicators are not convinced the market direction move is back up. This could be signaling another week of sideways action as we have witnessed so often since February. It helps that the market direction is not showing the typical topping action as in prior market tops (read this article on 2007 VS 2013).
Friday though may have just been a knee jerk reaction to the upside following Thursday’s market direction action to the downside because it did nothing except invalidate Thursday’s selling. So the market direction then is still sitting mixed with the bias to the neutral side. We could therefore see a shot higher out of the open on Monday and then a pull back to close unchanged or to the downside on Monday. A lot depends on Europe.
Overall though the market direction higher is still intact and investors remain convinced that higher prices are in the wings. The upcoming quarterly earnings may be all that the market needs to push market direction higher and indeed these latest earnings will tell investors a lot about the health of the US economy in general. Unemployment is improving which should also be seen in the health of companies and the GDP. Market direction staying sideways for the past week could have its hopes for higher valuations pinned to the upcoming earnings.
My personal outlook is for market direction to move higher, but I have to set aside personal observations and watch the market direction technical indicators and they are back advising caution until the market decides which way to turn next. This being the final week of March is a pivotal week as it should set the tone for April’s market direction.
Internal Market Direction Links
Profiting From Understanding Market Direction (Articles Index)
Understanding Short-Term Signals
Market Direction Candlestick Daily View (Members only)
Market Direction Portfolio Ongoing Trades (Members only)
Market Direction External Links
