Market Direction today was back to the worrying about Europe, Cyprus, Germany and an unlikely catalyst, more job growth. The Weekly Initial Unemployment Insurance Claims rose slightly but are still on track to provide possibly another month of 200,000 jobs created. If that is the case investors will become more unsettled as they worry about the Federal Reserve turning off the liquidity taps. I watched some analysts on CNBC commenting how the economy is definitely on the mend and even if the Federal Reserve should begin to tightened early, stocks will be fine.
I don’t have their conviction as to my way of thinking, when the Fed starts to tighten it could be time to raise more cash. Right now though the problem in Cyprus remains the primary focal point although the news of an economic contraction out of Germany, Europe’s powerhouse, was not taken lightly by investors both here and overseas.
Market Direction Action For Today
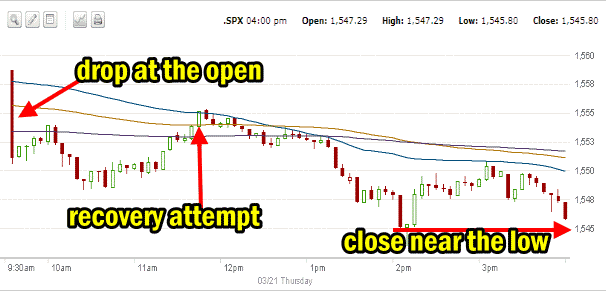
The S&P 500 opened with a gap down in market direction. A recovery attempt failed around 11:30 and from then the market direction remains steadily downhill until the S&P 500 closed near the low for the day. Not at all a bullish day. I had expected the S&P 500 to open weak and then spend most of the day trying to rally higher. I wasn’t expecting much but I did not expect this move lower into the close.

Market Direction chart on the S&P 500 - 5 minute - March 21 2013
Market Direction Closings
The S&P 500 closed at 1545.80 down 12.91 points and the Dow closed at 114,421.49 down 90.24 points. The NASDAQ closed at 3222.60 down 31.59 points.
Market Direction Technical Indicators At The Close of Mar 21 2013
Let’s take a moment now and review the market direction technical indicators at today’s close on the S&P 500 and view the next trading day’s outlook.

For Momentum I am using the 10 period. Momentum is neutral and ready to fall into negative territory marking a downturn in market direction.
For MACD Histogram I am using the Fast Points set at 13, Slow Points at 26 and Smoothing at 9. MACD (Moving Averages Convergence / Divergence) is as predicted yesterday, has turned negative and issued a sell signal part way through the day.
The Ultimate Oscillator settings are Period 1 is 5, Period 2 is 10, Period 3 is 15, Factor 1 is 4, Factor 2 is 2 and Factor 3 is 1. These are not the default settings but are the settings I use with the S&P 500 chart set for 1 to 3 months.
The Ultimate Oscillator is still positive but falling quickly. It will turn negative shortly.
Rate Of Change is set for a 21 period. Rate Of Change is still positive and despite the selling today it is only down slightly from yesterday. It is the only indicator that remains somewhat positive for market direction to continue higher.
For the Slow Stochastic I use the K period of 14 and D period of 3. The Slow Stochastic is overbought and still indicating that the market direction will be lower at the start of next week.
For the Fast Stochastic I use the K period of 20 and D period of 5. These are not default settings but settings I set for the 1 to 3 month S&P 500 chart when it is set for daily. The Fast Stochastic is also overbought and indicating that tomorrow will be lower than today.
Market Direction Outlook And Strategy for Mar 22 2013
The market direction outlook for the next trading day is to see more downside action unless something positive should happen in Europe. The consensus among the market timing indicators is that the market will once again turn lower. The Dow yesterday set another new high but that might be the last one for a while.
If the selling should pick up those who are still holding VIX Index Calls from the VIX Index Strategy Trade I discussed a couple of weeks ago, might end up doing quite well. I am disappointed to have sold out so quickly but my instincts told me that the recent selling was overdone and the market direction would continue higher and the VIX Index fall. That does not appear to be the case at the moment. More selling will shoot up the VIX Index and make it a great trade. I am sorry not to be along for the ride. I will have to content myself with my Spy Put Options trade and keep looking for more Put Selling Opportunities.
Tomorrow the weekly options expire again on a number of stocks including my Apple Stock Biweekly Put Selling Strategy which has worked out very well indeed. I am not sure if I will be selling puts tomorrow on Apple Stock but if I do I will post it as soon as I can.
Meanwhile the best trade today was my Bank Of Nova Scotia Stock which I had bought yesterday on the Toronto Stock Exchange. I bought it yesterday, sold it today and then bought it back in the morning. This time though it may end up being a covered calls trade as I am not sure BNS Stock will rebound unless the market direction turns around and moves back up.
The outlook then is for more selling tomorrow and I will be watching for opportunities to get busy with more Put Selling.
Internal Market Direction Links
Profiting From Understanding Market Direction (Articles Index)
Understanding Short-Term Signals
Market Direction Candlestick Daily View (Members only)
Market Direction Portfolio Ongoing Trades (Members only)
Market Direction External Links
