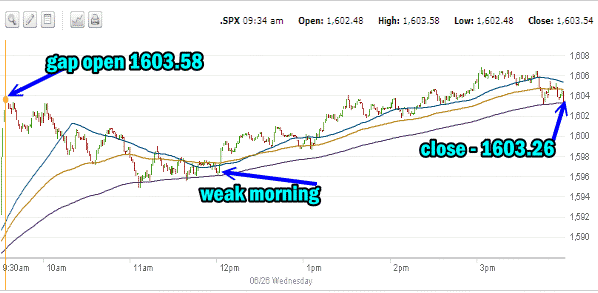
In my market direction outlook for today I had to call for a sideways day with not much up. I was a bit off as the open saw a big gap up and then weakness set in and finally a push back up to end sideways. I should have read more into the Fast Stochastic and Slow Stochastic indicators which both predicted market direction would be higher on Wednesday.
While the market direction did open with a gap up, you have to wonder if this is the end of the recent correction or simply a bounce back because the GDP came in lower than expected. With GDP coming in rather weak at just 1.8 percent, many analysts were busy talking about how Quantitative Easing will have to be maintained far longer than the Fed predicts. Some analysts were busy talking about 10 years of this type of easing. While it seems pretty far-fetched, it is strange to think that Quantitative Easing has been with stocks since 2008 which is almost 6 years.
Banks Everywhere Pushing Market Direction Back Up
The other aspect of the present environment is the number of central banks everywhere talking up low-interest rates and continued easing to keep stocks elevated. Tomorrow we get the Weekly Initial Unemployment Insurance Claims which should be interesting.
Market Direction Bounce Concern
The market direction bounce back still has me a bit concerned. While the market volume has not been great days like today have me staying with a cautious stance. The morning gap open placed the S&P 500 at 1603.58. Then the market dropped through most of the morning before picking itself back up in the afternoon. At the close the market direction really went just back to the morning gap open as the S&P closed at 1603.26. This is not the type of recovery I would expect if the market direction was indeed breaking free of the recent correction. At the close today, the S&P 500 is still below the 50 period moving average but has managed to close above 1600. The drop back in the morning may turn out to be a test to see how strong resistance was at 1600.

Market Direction Closing For June 26 2013
The S&P 500 closed at 1,603.25 up 15.23 and back above 1600. The Dow closed at 14,910.14 up 149.83 and 90 points shy of 15,000. The NASDAQ closed at 3,376.22 up 28.34.
Market Direction Technical Indicators At The Close of June 26 2013
Let’s review the market direction technical indicators at the close of June 26 2013 on the S&P 500 and view the market direction outlook for June 27 2013.
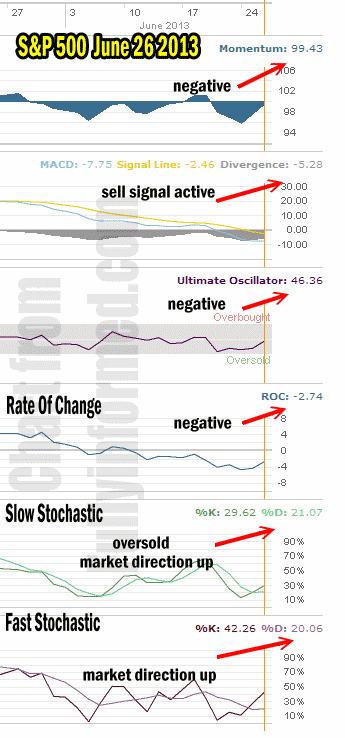
For Momentum I am using the 10 period. Momentum remains negative but is nearing positive as it continues to climb.
For MACD Histogram I am using the Fast Points set at 13, Slow Points at 26 and Smoothing at 9. MACD (Moving Averages Convergence / Divergence) issued a sell signal on May 24. The sell signal is strongly negative although it is rising from yesterday.
The Ultimate Oscillator settings are Period 1 is 5, Period 2 is 10, Period 3 is 15, Factor 1 is 4, Factor 2 is 2 and Factor 3 is 1. These are not the default settings but are the settings I use with the S&P 500 chart set for 1 to 3 months.
The Ultimate Oscillator is no longer oversold although it is negative.
Rate Of Change is set for a 21 period. The rate of change is negative for the 12th day and is moving higher.
For the Slow Stochastic I use the K period of 14 and D period of 3. The Slow Stochastic is signaling that the market direction is up and it remains oversold.
For the Fast Stochastic I use the K period of 20 and D period of 5. These are not default settings but settings I set for the 1 to 3 month S&P 500 chart when it is set for daily. The Fast Stochastic is indicating that the market direction is up and it is no longer oversold.
Market Direction Outlook And Strategy for June 27 2013
The market direction technical indicators are painting a different picture on Wednesday after the S&P 500 closed. Momentum is just about ready to turn positive. MACD though remains fairly unimpressed with the recent rally and is still very negative. This could be the signal that turns out to be right if the market direction turns back down. Among the most interesting technical indicators I the Ultimate Oscillator which is no longer oversold but is not positive either. The Fast Stochastic is also no longer oversold. Between these two indicators I am going to be watching on Thursday to see what will happen when the S&P 500 is no longer oversold.
If this was just a bounce back from a heavily oversold market direction, we should be entering a sideways to down period right about now. \
My personal outlook is that the market direction up may still have room to move, but MACD being so negative is definitely a concern. It is rare when MACD is not correct in its outlook.
I am back Put Selling having done Put Selling against PepsiCo Stock on Wednesday and looking to do more if we get a bit of a pull back, but I am not spending a lot of my capital just yet. To me the overall market direction outlook has to be lower at some point soon primarily because the present valuations on too many stocks just does not make sense. Stocks are overvalued and earnings are not strong enough to support present valuations. In the last correction stocks fell back but only slightly and then have pushed back up again.
For tomorrow I think we will see a movement sideways and then down slightly as we have had a number of very good rally back days. Market direction I think will give a clear indication shortly as to what direction it will be heading for July. At present I am staying out of the money with my Put Selling and selling only small positions to keep cash back, just in case the S&P 500 continues its market direction move lower, shortly.
Market Direction Internal Links
Profiting From Understanding Market Direction (Articles Index)
Understanding Short-Term Signals
Market Direction Portfolio Trades (Members)
Market Direction External Links
