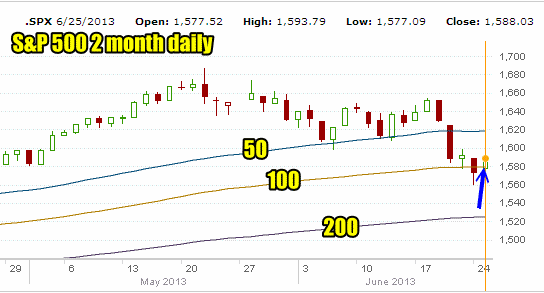
Despite what the market direction technical indicators had said yesterday, the market direction spent the entire day trying to climb back above the 100 period exponential moving average (EMA). Market direction managed to push back and did close near the highs for the day and just slightly above the 100 period moving average but proof is needed to convince investors that the selling is over for now.
Market Direction Action for June 25 2013
The two month daily S&P 500 chart below shows how the market direction fell below the 50 period EMA to the 100 period and today closed back just slightly above it. But for this market direction to continue higher it will have to recover the 1600 level and hold it. That is the proof needed to confirm the market direction is indeed back up.

Market Direction Closing For June 25 2013
The S&P 500 closed at 1,588.03 up 14.94 and the Dow closed at 14,760.31 up 100.75. The NASDAQ closed at 3,347.89 up 27.13.
Market Direction Technical Indicators At The Close of June 25 2013
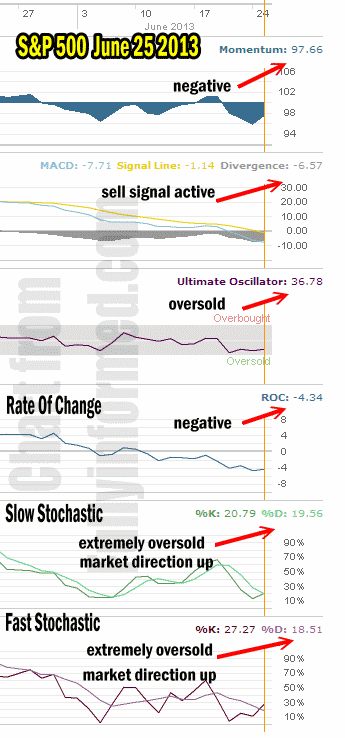
Let’s review the market direction technical indicators at the close of June 25 2013 on the S&P 500 and view the market direction outlook for June 26 2013.

For Momentum I am using the 10 period. Momentum remains negative.
For MACD Histogram I am using the Fast Points set at 13, Slow Points at 26 and Smoothing at 9. MACD (Moving Averages Convergence / Divergence) issued a sell signal on May 24. The sell signal is strongly negative.
The Ultimate Oscillator settings are Period 1 is 5, Period 2 is 10, Period 3 is 15, Factor 1 is 4, Factor 2 is 2 and Factor 3 is 1. These are not the default settings but are the settings I use with the S&P 500 chart set for 1 to 3 months.
The Ultimate Oscillator is oversold which is the same signal as yesterday.
Rate Of Change is set for a 21 period. The rate of change is negative for the eleventh day and is moving sideways despite today’s rally.
For the Slow Stochastic I use the K period of 14 and D period of 3. The Slow Stochastic is signaling that the market direction is up but only slightly and it remains extremely oversold.
For the Fast Stochastic I use the K period of 20 and D period of 5. These are not default settings but settings I set for the 1 to 3 month S&P 500 chart when it is set for daily. The Fast Stochastic is indicating that the market direction is up and it too remains extremely oversold.
Market Direction Outlook And Strategy for June 26 2013
Despite the change in outlook for the Fast Stochastic and Slow Stochastic indicators we need a lot more proof before committing a lot more capital back to Put Selling against this market direction. For tomorrow I believe there will be more weakness than today and the market direction will move more sideways than up.
Market Direction Internal Links
Profiting From Understanding Market Direction (Articles Index)
Understanding Short-Term Signals
Market Direction Portfolio Trades (Members)
Market Direction External Links
