In my market direction intraday comments on Friday I wrote how despite all the media hype, this remains a shallow correction and until 1600 breaks on the S&P 500 I see little to be concerned about. Friday was another good example. While the media was hyped up on the decline following Thursday’s big bounce back, the actual market direction was seen in the market direction technical indicators at the close of Wednesday. On that day I wrote how the market should bounce back and then fall lower. Along came Thursday and the market jumped higher for a very nice but slightly overdone bounce back and then Friday we are back to selling and a move lower again.
Friday’s market at the close, set up the outlook for Monday and it remains mixed, choppy and still bullish to a certain extent. Let’s take a look at the S&P 50 market direction.
Market Direction S&P 500
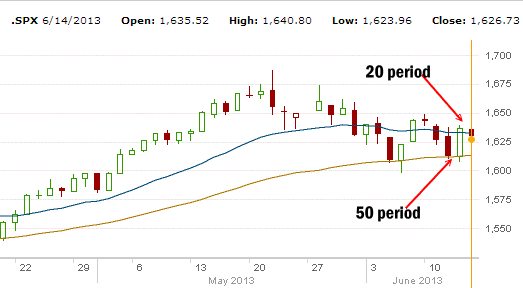
When you look at the market direction for the past two weeks below you can see that the 50 period exponential moving average (EMA) holds key importance for the S&P 500 overall market direction. Twice two weeks ago and twice again last week the S&P 500 fell back to the 50 period EMA but refused to fall through. On Friday the S&P 500 was back just below the 20 period moving average. We should not get another test of the 50 period this upcoming week. If we do fall back again to the 50 period I believe we will break it and move lower. At present though I think the move for early next week is higher to back above the 20 period moving average.

Market Direction June 14 2013 S&P 500
IWM ETF Market Direction
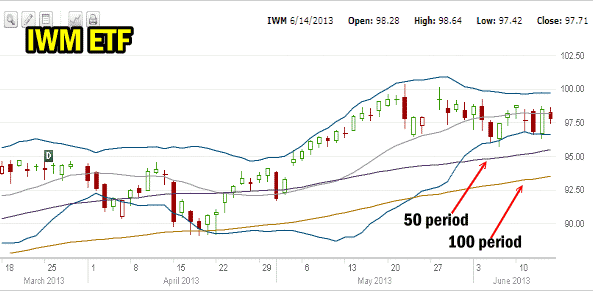
The other chart worth looking at is the IWM ETF which is the Russell 2000. This ETF follows some of the best small to mid capital stocks in the market place. Back in April this ETF pushed back below the 50 period moving average and then fell to the 100 period exponential moving average (EMA). A lot of analysts concluded from the movement of the IWM ETF in April that the market direction was decisively lower. They were wrong and the market direction pushed decisively higher.
However unlike back in April, this correction in the IWM ETF has been even shallower with the ETF not yet falling to the 50 period moving average. Indeed the IWM ETF is stuck more sideways than any other direction. This holds a lot of credibility with me. I believe it is signaling that the market direction remains bullish and will shortly try to push higher again. The only concern I have with the IWM ETF is that it has held the Lower Bollinger Band for the past 4 sessions. This has caused the Bollinger Bands to enter into a squeeze formation. Normally a squeeze of the Bollinger Bands with IWM clinging more to the Lower Bollinger Band than the Middle Bollinger Band or Upper Bollinger Band means this ETF is about to fall. Personally I do not see this happening but the weight of statistics points more to a better chance the ETF will fall than it will rise. Still though I think there is more bullishness in the small to mid-cap stocks and a good chance the ETF will try to push higher.

IWM ETF Market Direction June 14 2013
Market Direction Closing For June 14 2013
The S&P 500 closed at 1,626.73 down 9.63 points. The Dow closed at 15,070.18 down 105.90 points. The NASDAQ closed at 3,423.56 down 21.81 points.
Market Direction Technical Indicators At The Close of June 14 2013
Let’s review the market direction technical indicators at the close of June 14 2013 on the S&P 500 and view the market direction outlook for June 15 2013.

Market Direction Technical Analysis for June 14 2013
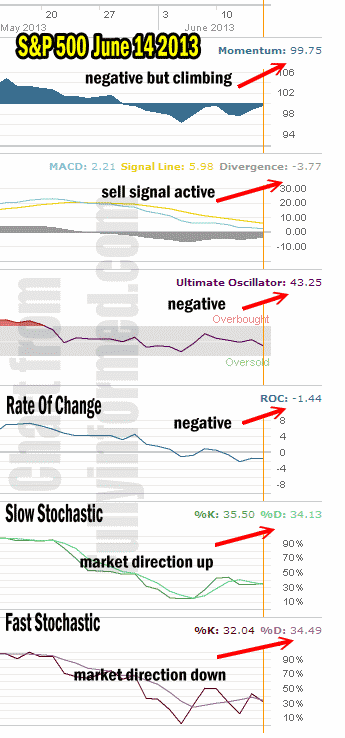
For Momentum I am using the 10 period. Momentum is still negative on Friday and has now been negative since May 29. The push higher lower though did not push momentum lower. Instead momentum moved higher on Friday. This often signals that buyers are picking up stocks on the dips during the day.
For MACD Histogram I am using the Fast Points set at 13, Slow Points at 26 and Smoothing at 9. MACD (Moving Averages Convergence / Divergence) issued a sell signal on May 24. The sell signal is still valid and it remains with a wide divergence but it was less negative on Friday than on Thursday another signal that buyers were busy picking up stocks.
The Ultimate Oscillator settings are Period 1 is 5, Period 2 is 10, Period 3 is 15, Factor 1 is 4, Factor 2 is 2 and Factor 3 is 1. These are not the default settings but are the settings I use with the S&P 500 chart set for 1 to 3 months.
The Ultimate Oscillator is back negative.
Rate Of Change is set for a 21 period. The rate of change is negative for the fourth day.
For the Slow Stochastic I use the K period of 14 and D period of 3. The Slow Stochastic is now signaling that the market direction is up despite Friday’s move lower.
For the Fast Stochastic I use the K period of 20 and D period of 5. These are not default settings but settings I set for the 1 to 3 month S&P 500 chart when it is set for daily. The Fast Stochastic is disagrees with the Slow Stochastic and is signaling market direction is down for Monday. As the Slow Stochastic is signaling more than a day out, the Fast Stochastic could be correct for Monday but then the market may recover mid-week according to the Slow Stochastic.
Market Direction Outlook And Strategy for June 17 2013
Once again there is not a lot to say about the market direction. There is no big change yet. The Market Direction Technical Indicators are mixed in their outlook. Yet while there is weakness reflected in the Market Direction Technical Indicators there is also underlying strength. I would definitely not be short this market at this time.
For Monday I see a choppy session continuing but many of the technical indicators are showing that market direction is more up than down or sideways. Therefore we may see some weakness at the open but then a move higher into the close on Monday. It may not be much of a move higher but I think enough strength exists that investors may end up elevating prices slightly on Monday.
Market Direction Internal Links
Profiting From Understanding Market Direction (Articles Index)
Understanding Short-Term Signals
Market Direction Portfolio Trades (Members)
Market Direction External Links
