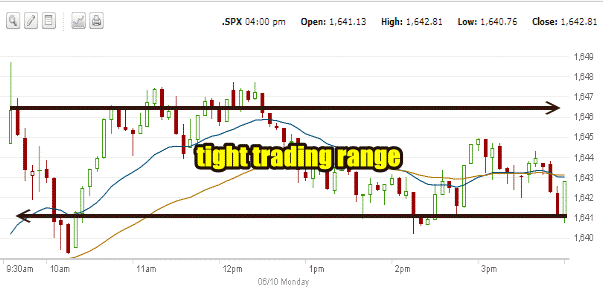
The market direction outlook for Monday was for a bit of a breather after two big up days last week. Indeed today the market direction followed exactly that. There were some interesting moves in stocks like McDonalds Stock (MCD) which moved up over $100 once again before closing $99.53 and Disney Stock which fell 1.57% to close at $63.83. Overall the market advance decline pretty much summed up today’s action with 50.8% of stock rising and 44.3% of stocks declining. Throughout the past 6 months more stocks have made new highs than stocks setting new lows and today again, 300 new highs were made while 123 stocks made new lows.
Put Selling McDonalds Stock
On the weekend I wrote this MCD Stock article discussing why I believe this is a good time for Put Selling McDonalds Stock so I hope readers had a chance to review the article.
Market Direction Chart for June 10
Today’s S&P 500 chart is non-eventful. The market spent the day primarily consolidating the recent move back up and working out the overbought market condition. You can see in the 5 minute daily chart below that today the market traded within a tight range. While primarily not a very exciting day I did have two trades today. One was with PSX Stock and the other was a trading for pennies trade right at the end of the day. Both of these were posted to my twitter account. If you are seeking trade alerts twitter is probably the best as it affords the quickest method for me to post a trade. I do my best to post to twitter throughout the day although some days are busy making it difficult to post my trades as they happen. Today was pretty easy to post trades to twitter. You can join my twitter account by going to twitter.com and my username is befullyinformed. You can select the twitter account from the Tweets in the right column.

Market Direction Closing For June 10 2013
The S&P 500 closed at 1,642.81 down just 0.57 points. The Dow closed at 15,238.59 down 9.53 points. The NASDAQ closed at 3,473.77 up 4.55 points.
Market Direction Technical Indicators At The Close of June 10 2013
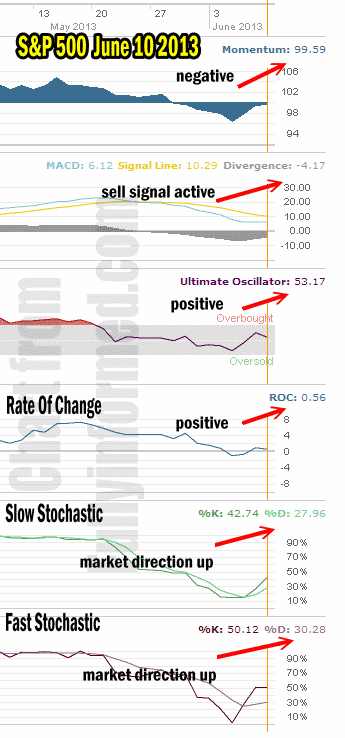
Let’s review the market direction technical indicators at the close of June 10 2013 on the S&P 500 and view the market direction outlook for June 11 2013.

For Momentum I am using the 10 period. Momentum which has been collapsing remained negative again today despite moving higher on Friday. At this point I do not see this as a concern due to the strong sideways motion of the market direction today.
For MACD Histogram I am using the Fast Points set at 13, Slow Points at 26 and Smoothing at 9. MACD (Moving Averages Convergence / Divergence) issued a sell signal on May 24. The sell signal is still valid and again today the signal is still quite negative although it is moving higher.
The Ultimate Oscillator settings are Period 1 is 5, Period 2 is 10, Period 3 is 15, Factor 1 is 4, Factor 2 is 2 and Factor 3 is 1. These are not the default settings but are the settings I use with the S&P 500 chart set for 1 to 3 months.
The Ultimate Oscillator is back positive but turned down from yesterday. Again I do not see this as a concern for today.
Rate Of Change is set for a 21 period. The rate of change is also back positive and the movement sideways is to be expected today.
For the Slow Stochastic I use the K period of 14 and D period of 3. The Slow Stochastic is signaling that the market direction is now back to up.
For the Fast Stochastic I use the K period of 20 and D period of 5. These are not default settings but settings I set for the 1 to 3 month S&P 500 chart when it is set for daily. The Fast Stochastic is also signaling market direction is up. It was the fast stochastic that signaled market direction up on Friday and is still signaling a strong up move ahead for Tuesday. Strong could mean anywhere from a couple of points and higher.
Market Direction Outlook And Strategy for June 11 2013
There is not a lot to say this evening for tomorrow’s outlook. The Market Direction Technical Indicators are still dominantly turning more positive which reflects that the market may be able to push higher on Tuesday. Historically Tuesdays have been strong since January.
On Tuesday then I am expected the markets to perhaps open sideways with a possible movement slightly lower but then a push higher should take place during the day. Whether the market direction can stay higher I am not sure although the technical indicators are signaling that it will be higher tomorrow. For now I prefer to stay on the side of caution and watch for clear signals of a move higher that is not a trap. There are no indication that there is a trap ahead but until the market can continue convincingly higher, this rally remains suspect.
Market Direction Internal Links
Profiting From Understanding Market Direction (Articles Index)
Understanding Short-Term Signals
Market Direction Portfolio Trades (Members)
Market Direction External Links
