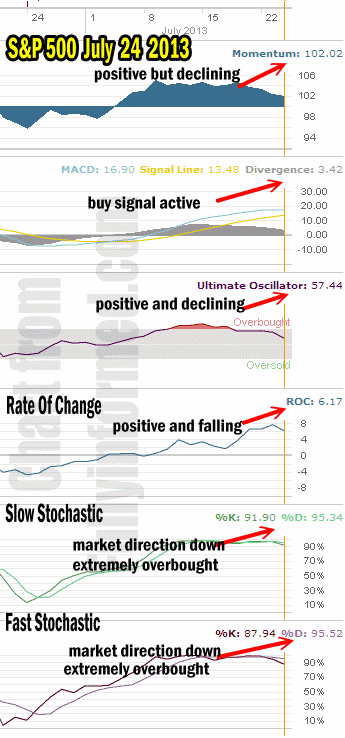
The market direction outlook for Wednesday was for the market to try to push higher but stay sideways. Instead the market direction pushed lower and then turned sideways. The revenue from Caterpillar Stock hurt investors’ confidence. Despite this investors are still hanging onto their stocks and looking for the market direction to move higher. The market direction technical indicators however are not as convinced that the market direction will push higher. Instead the indicators are beginning to show signs of weakness in the market direction up.
Market Direction Closing For July 24 2013
The S&P 500 closed at 1,685.94 down 6.45. The Dow closed at 15,542.24 down 25.50. The NASDAQ closed at 3,579.60 up just 0.33.
Market Direction Technical Indicators At The Close of July 24 2013
Let’s review the market direction technical indicators at the close of July 24 2013 on the S&P 500 and view the market direction outlook for July 25 2013.
The Market Direction Technical Analysis is showing that the overbought condition is continuing to weaken the uptrend.
For Momentum I am using the 10 period. Momentum on Wednesday continued under heavy pressure and is sliding lower.
For MACD Histogram I am using the Fast Points set at 13, Slow Points at 26 and Smoothing at 9. MACD (Moving Averages Convergence / Divergence) issued a buy signal on July 5. The buy signal also continued to weaken on Wednesday but again it is important to realize that MACD is showing that the market direction remains up.
The Ultimate Oscillator settings are Period 1 is 5, Period 2 is 10, Period 3 is 15, Factor 1 is 4, Factor 2 is 2 and Factor 3 is 1. These are not the default settings but are the settings I use with the S&P 500 chart set for 1 to 3 months.
The Ultimate Oscillator is still positive but is falling and is no longer overbought.
Rate Of Change is set for a 21 period. The rate of change is positive but pulling back. I indicated yesterday that often when the rate of change has signals such as yesterday’s high reading that it is often followed by weakness. We are seeing that weakness today.
For the Slow Stochastic I use the K period of 14 and D period of 3. The Slow Stochastic is signaling that the market direction is now down and the Slow Stochastic remains overbought.
For the Fast Stochastic I use the K period of 20 and D period of 5. These are not default settings but settings I set for the 1 to 3 month S&P 500 chart when it is set for daily. The Fast Stochastic is indicating that the market direction is down and it reflects the extreme overbought condition of the market.
Market Direction Outlook And Strategy for July 25 2013
The market direction higher is continuing to stall. With the S&P 500 and Dow at all time highs it is not unusual for the markets to take a breather. However this may be more than just a short rest.
The market direction technical indicators all reflect growing weakness in the uptrend. It is rare when the indicators are wrong in their outlook. That said, since January the market has surprised to the upside each time the market direction pulls back for a couple of days. This could easily be another such case.
The VIX Index closed today back above $13.00 and reflects the growing concern that the markets may not be able to hold onto the lifty gains it has presently made. I am continuing with Put Selling and looking for other opportunities but I am watching carefully for any signals that the market direction is about to turn lower.
Market Direction Internal Links
Profiting From Understanding Market Direction (Articles Index)
Understanding Short-Term Signals
Market Direction Portfolio Trades (Members)

