Market Direction today followed pretty well my market direction outlook I posted yesterday after the market closed. To review yesterday’s market direction column select this link.
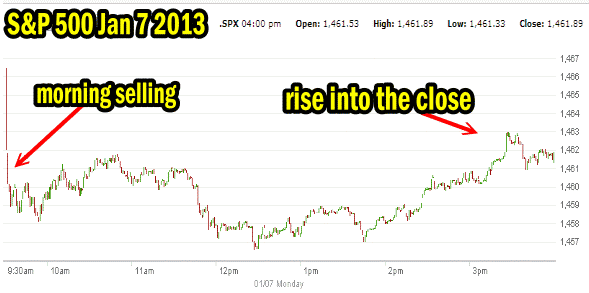
The market direction open up and promptly fell. The market direction low of the day was set late morning and from there the market direction climbed back. Today’s market direction was almost exactly as expected including the rise into the close. This is a sign that institutional money and large investors and hedge funds are buying stocks in the market weakness and getting ready for a push back up. Tuesday is the start of the quarterly earnings season as Alcoa Stock makes the first report. Let’s look at today’s S&P 500 chart.
Market Direction S&P 500 Chart
The chart below shows the earning morning plunge, then a move sideways, an attempt to rally and then the plunge to the day’s low. From there the market direction rose into the close. This is actually a consolidation chart which shows strength in the markets, not weakness. The market direction up is definitely still in tact.

Market Direction Throughout The Day - Jan 7 2013 - 1 minute time frame
The S&P500 closed at 1461.49, down 4.98 points or just 0.3 percent and the Dow closed down 50.92 points to 13,384.29 or 0.4 percent. The NASDAQ fell only 2.84 points which was excellent considering that at one point Apple Stock was down to $515 before closing back up to $523.90 a loss of just $3.10.
Key commodities ended the day relatively unchanged. Crude oil rose to $93.19 (U.S.) a barrel, up 10 cents and gold fell only $2.60 to $1,646.30 an ounce. With so many analysts bearish, gold stocks like Barrick were down 1.7 percent. There remains a large disconnect between the actual price of gold and the stock of gold producers.
Market Direction Technical Indicators Of Jan 7 2013
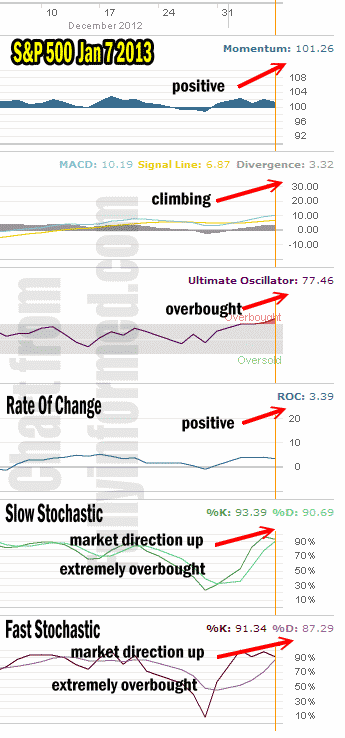
Let’s look at the market direction technical indicators for the S&P 500 at the close of Jan 7 2013 to see what they are telling us.

Market Direction Technical Analysis - Jan 7 2013
For Momentum I am using the 10 period. Momentum is still positive but two days of sideways is slowing momentum.
For MACD Histogram I am using the Fast Points set at 13, Slow Points at 26 and Smoothing at 9. MACD (Moving Averages Convergence / Divergence) is still climbing after issuing the most recent buy signal.
The Ultimate Oscillator settings are Period 1 is 5, Period 2 is 10, Period 3 is 15, Factor 1 is 4, Factor 2 is 2 and Factor 3 is 1. These are not the default settings but are the settings I use with the S&P 500 chart set for 1 to 3 months.
The Ultimate Oscillator is now very overbought. This does not mean the market direction has to turn down, but often it will as the market continues to consolidate.
Rate Of Change is set for a 21 period. Rate Of Change is still positive although down slightly from yesterday.
For the Slow Stochastic I use the K period of 14 and D period of 3. The Slow Stochastic is extremely overbought and while still bullish it is signaling that the market direction may be sideways later in the week.
For the Fast Stochastic I use the K period of 20 and D period of 5. These are not default settings but settings I set for the 1 to 3 month S&P 500 chart when it is set for daily. The Fast Stochastic is also extremely overbought and although indicating market direction is up, the Fast Stochastic is showing that consolidation is underway.
Market Direction Outlook And Strategy
The market direction outlook tomorrow is pretty much unchanged. There are enough signals to advise caution and look for opportunities to do Put Selling on favorite large caps that have dipped over the past two days of trading.
Meanwhile the Ultimate Oscillator, Slow Stochastic and Fast Stochastic are all signaling that the market direction is consolidating at this point. There are no warnings of an impending big drop in market direction and lots of signs of strength in the market direction.
For investors using the Trading For Pennies Strategy consider continuing to trade with the directional trend. I will not be surprised to once again see weakness in the morning and then a gradual recovery into the close. Today I did Put Selling on Procter and Gamble Stock (PG Stock) and I am looking at YUM Stock once again.
Market Direction then for Jan 8 2013 is for investors to see a day like today. If earnings from Alcoa disappoint the market direction will fall further than yesterday but I still expect to see a rise toward the close and not a lower low in market direction into the close.
Internal Market Direction Links
