Market direction on Friday was exciting to watch as the S&P 500 finished at a 5 year high squeaking past the Sept 14 2012 high of 1465.77 to close at 1466.47. The S&P 500 and the Dow are now nearing their all time peaks and for many investors it looks like the stock market direction is at a lofty height.
The Dow gained 43.85 points, or 0.33 percent, to 13,435.21 and the NASDAQ hardly budged with a gain of just 1.09 points. Apple Stock again hurt the NASDAQ as it fell 2.78 percent or $15.10 closing at $527.00. The news of Samsung smartphones shipments surging beyond anything Apple has shipped to date didn’t help the stock any. Meanwhile on Friday the US added 155,000 jobs in December as the recovery inches along. The employment gains were broad-based with gains in just about every industry and field. As well the Institute for Supply Management showed USA service sector activity expanded at a rate that was the most in 10 months.
Overall though it was an excellent week with market direction solidly up and the S&P 500 putting in the largest weekly gain in a year. As well all the indexes are back above the important 50, 100 and 200 day moving averages. Last week the S&P 500 gained 4.6 percent, the Dow rose 3.8 percent and the NASDAQ jumped 4.8 percent to post their largest weekly percentage gains in more than a year.
Market Direction and VIX Index
The VIX Index which just a week earlier was above 20, closed down 5% on Friday at $13.83 nearing the 52 week lows as investor concern diminished as the past week progressed. This marked the fourth straight drop for the VIX Index with a decline of 40 percent. Imagine those investors who had puts on the VIX Index from the prior week.
Market Direction From The Top of The Hill
With stocks now at the highest levels since the 2008 to 2009 market crash, the market direction may need some catalyst or event to push the indexes higher. Many analysts are looking at the upcoming quarterly earnings which start on Tuesday with Alcoa, to possibly surprise to the upside, but many analysts have cut their outlook for stocks so any surprises to the downside could rattle investors.
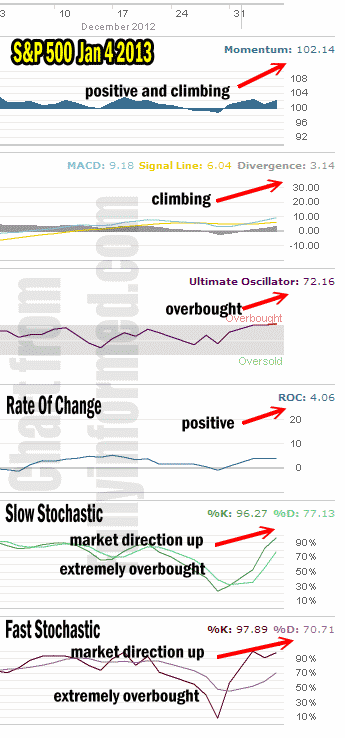
Market Direction Technical Indicators of Jan 4 2013
Market direction technical indicators for Jan 4 2013 show a market direction up with strength but extremely overbought. The market direction move higher last week, caught investors by surprise with its strength and stocks need more time to consolidate. This will only happen if investors stop pushing stocks higher.

Market Direction Jan 4 2013
For Momentum I am using the 10 period. Momentum is still moving higher on Jan 4.
For MACD Histogram I am using the Fast Points set at 13, Slow Points at 26 and Smoothing at 9. MACD (Moving Averages Convergence / Divergence) is still supporting the recent buy signal and indicating that the market direction is higher as it continued to rise on Friday.
The Ultimate Oscillator settings are Period 1 is 5, Period 2 is 10, Period 3 is 15, Factor 1 is 4, Factor 2 is 2 and Factor 3 is 1. These are not the default settings but are the settings I use with the S&P 500 chart set for 1 to 3 months.
The Ultimate Oscillator is extremely overbought and needs a pullback.
Rate Of Change is set for a 10 period. Rate Of Change is still positive and the move higher has slowed considerably pointing to a possible short-term pullback for stocks.
For the Slow Stochastic I use the K period of 14 and D period of 3. The Slow Stochastic is extremely overbought but signaling stocks will be higher in a few days time.
For the Fast Stochastic I use the K period of 20 and D period of 5. These are not default settings but settings I set for the 1 to 3 month S&P 500 chart when it is set for daily. The Fast Stochastic is also extremely overbought but continues to point to stocks being able to move higher.
Market Direction Outlook And Strategy
The market direction outlook for Monday Jan 7 is for stocks to be pressured to rest or pullback short-term. This may not happen as investors remains convinced that the market direction is higher and they are continuing to purchase stocks. Monday then could see some weakness to start the day off but the markets may continue to try to grind higher.
If Monday remains a sideways day, those doing the Trading For Pennies Strategy may want to sit the day out unless the market direction is clear in either direction. With the market direction signaling extremely overbought which could see a slight pullback and then some late day buying, those doing the Trading For Pennies Strategy may want to look for the best trade first thing in the morning when the market might pullback to start the day and then late in the day if the market tries to rally back.
Just a prediction of course, but with so many overbought signals, the market direction really needs a catalyst of some kind to push towards the all-time highs. If the market direction continues higher this month and takes out the all-time highs there are going to be a lot of angry analysts and investors who have called for this bull market to collapse pretty well since it started in 2009. Many investors both small and large fled the markets in 2008 to 2009 and have not returned. This sense of negativity continues to support the market direction continuing to push up. This week I will still be continuing to apply capital to my trades.
Internal Market Direction Links
