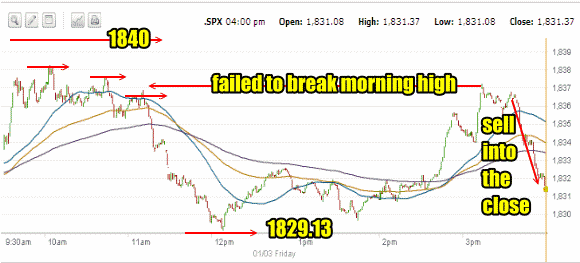
The market direction outlook for Friday Jan 3 was for the market direction to move lower. Instead while the market direction did move lower it was really more a whipsaw day as you’ll see in the chart below. Investing is very emotional for most investors. The fact that the first trading day of the new year was a down day created a lot of nervousness among investors. The Wells Fargo downgrade of Apple Stock hurt the NASDAQ index. Most investors seem to be aware that the first two trading days of 2014 are important for the overall year’s direction and while it may seem absurd to think 2 days can actually set a trend, emotionally a lot of investors are worried. That worry showed up on Friday with stocks whipsawing. Let’s take a closer look.
Market Direction S&P 500 Intraday For Jan 3 2014
Friday’s early morning saw the market push back up and by 10:00 AM an early morning high was put in. The market direction failed to reach 1840 and once the morning high was put in two additional attempts failed and ended with both rallies having lower highs. Once the second rally ended lower, investors sold the market down to a low of 1829.13 at noon. While analysts lamented the selling as a harbinger of even more selling to come in the day, they missed the fact that the 12:00 low of 1829.13 was still above the low from Thursday. When the market did not break down, investors stepped back and decided to pick away at stocks. By the late afternoon another high was put in but it failed to break the first rally from the morning. That seemed to worry investors who sold the market lower into the close as the market ended at 1831.37.

Advance Declines For Jan 3 2014
Despite the way the chart may have shown stocks to be moving, advancers outpaced decliners by a wide margin with 62% of stock advancing and only 35% declining. There were 103 new highs and just 78 new lows. We can see again that there is strength in the market and investors want to push stocks higher.
Market Direction Closings For Jan 3 2014
The S&P closed at 1831.37 down just 61 cents. The Dow closed at 16,469.99 up 28.64. The NASDAQ closed at 4131.91 down 11.16.
The IWM ETF closed at 114.69 up 58 cents and within easy striking distance of breaking the all-time high of $115.97.
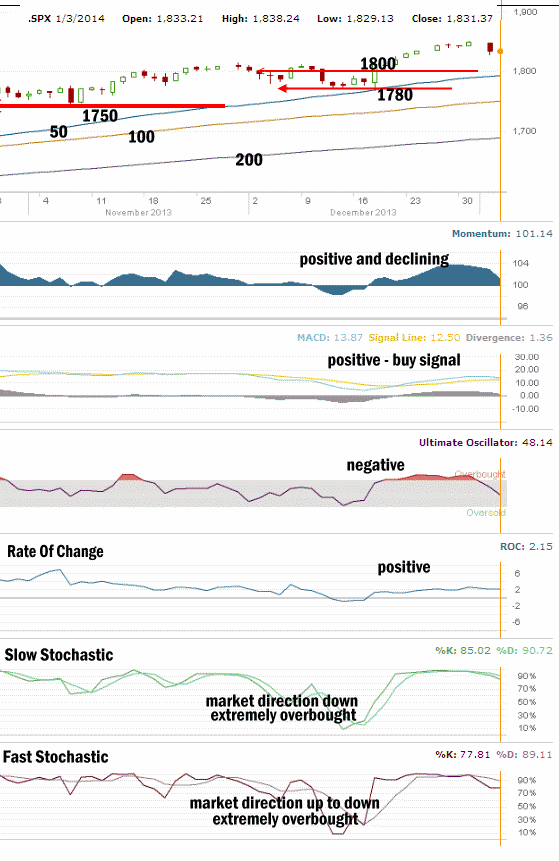
Market Direction Technical Indicators At The Close of Jan 3 2014
Let’s review the market direction technical indicators at the close of Jan 3 2014 on the S&P 500 and view the market direction outlook for Jan 6 2014.

The most important support line in the S&P 500 is still at 1750. That support line is holding the market direction up at present and that has not changed. The second support level of 1780 is very light support followed by third band of light support at 1800.
For Momentum I am using the 10 period. Momentum has been the best indicator over the past two months, replacing MACD as the most accurate indicator. Momentum is positive but took a second big drop on Friday.
For MACD Histogram I am using the Fast Points set at 13, Slow Points at 26 and Smoothing at 9. MACD (Moving Averages Convergence / Divergence) issued a buy signal on Dec 23. That buy signal was strong and has been confirmed.On Friday MACD pulled back again but is still positive.
The Ultimate Oscillator settings are Period 1 is 5, Period 2 is 10, Period 3 is 15, Factor 1 is 4, Factor 2 is 2 and Factor 3 is 1. These are not the default settings but are the settings I use with the S&P 500 chart set for 1 to 3 months.
The Ultimate Oscillator has fallen in dramatic fashion and is now negative as it points to lower prices for stocks.
Rate Of Change is set for a 21 period. The Rate Of Change is positive for the 10th day and is falling back slightly from Thursday’s move higher.
For the Slow Stochastic I use the K period of 14 and D period of 3. The Slow Stochastic is still signaling the market direction is down. The Slow Stochastic is extremely overbought.
For the Fast Stochastic I use the K period of 20 and D period of 5. These are not default settings but settings I set for the 1 to 3 month S&P 500 chart when it is set for daily. The Fast Stochastic is also signaling market direction down for Monday.
Market Direction Outlook And Strategy for Jan 6 2014
The market direction technical indicators are mixed but overall are pointing to additional weakness to start the week. The Ultimate Oscillator and both the Slow Stochastic and Fast Stochastic are negative. The remaining 3 indicators are still positive but have pulled back strongly from their recent highs and are warning investors that the weakness must be contained here or it will grow quickly.
However the intraday low on Friday was higher than the intraday low on Thursday. The Rate of Change also is showing that more investors are busy picking selectively through some stocks and the Russell 2000 is still well within striking distance of its most recent all-time high.
While the technical indicators are showing that there is a good chance of more weakness on Monday, I am of the opinion that stocks will push higher on Monday following two days of weakness to start off the new year. So we have a divide. The technical indicators are mixed with the bias to the downside and I believe we could see the market attempt to move back higher on Monday.
Market Direction Internal Links
Profiting From Understanding Market Direction (Articles Index)
Understanding Short-Term Signals
Market Direction Portfolio Trades (Members)
Market Direction External Links
Market Direction IWM ETF Russell 2000 Fund Info
Market Direction SPY ETF 500 Fund Info
