Market Direction today was down as was expected. The market direction technical indicators yesterday showed market direction as down for a day or two and then a move higher. There were a few interesting events today but perhaps the most interesting was the suggestion by the Federal Reserve minutes that stimulus through the bond buying program could end in 2013. Doesn’t this seem odd when it was just a few months ago that the Fed announced it would not raise interest rates until unemployment was down to 6.5% or inflation was up to 2.5%? While dropping the bond buying program is not raising interest rates it does begin to make investors wonder what, if anything, the Fed has left.
Earlier today I posted an article looking at the Weekly Initial Unemployment Insurance Claims which I use as a market timing system. In that article I discussed how for most of 2012 the weekly initial unemployment insurance claims averages around 372,000 weekly despite everything the Fed was doing. Perhaps the Fed was becoming aware of the fruitlessness of trying to stimulate employment further.
While the market direction today did not react too badly on the news, this could be a game changer as an end to this type of stimulus could revive the US Dollar which would hurt stocks and the yield on Treasury Notes would probably rise as well. This could make a rise of stocks against such a backdrop more difficult. Only time will tell but it is worth keeping a close watch for any change in the market direction technicals as 2013 progresses.
Today’s Market Direction Closings
Stocks ended lower today after a two-day rally that saw the S&P 500 closed at 1459.37, down 3.05 points or 0.2 per cent. The DOW closed at 13,391.36, down 21.19 points or 0.2 per cent and the NASDAQ closed down 11.70 points to 3100.
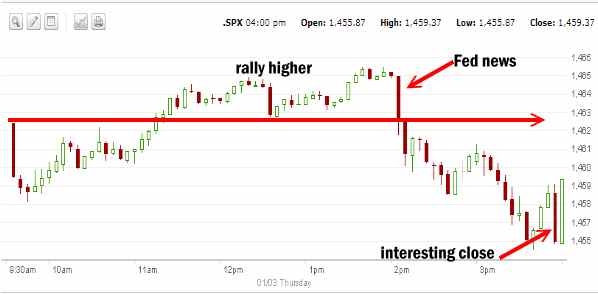
Market Direction S&P 500 Chart for Jan 3 2013
The day commenced with some selling which was expected and then a push back higher. The second little rally bounced off yesterday’s close and moved higher until the fed News hit the investors. The market then fell with a sharp drop at the end and just as sharp a rise minutes later.

Market Direction for Jan 3 2013
After two days of an enormous market rally on the fiscal cliff event, it is not surprising that there was market direction weakness today. I was surprised the S&P in the late morning staged a strong enough market direction rally to push back above yesterday’s close. I had expected the market direction to be negative all day.
Market Direction and Payroll Numbers
Friday brings the employment numbers for December. The market is expecting on average 151,000 more jobs to be created. If this figures is too high the market direction will fall back. If more jobs than 140,000 were created the market direction should see a bounce.
Market Direction And Some Stocks
A couple of interesting developments with stocks today. Family Dollar Stores collapsed over 13% after reducing its outlook and reporting disappointing sales for the latest quarter. The Gap meanwhile rose 2.3 percent as it reported sales growth of 5%. The Gap has been an interesting trade throughout 2012 but I prefer to stay away from stores that specialize in one item, like clothing. That said, the Gap last January (2012) was trading around $18.00 and is up 77%. Imagine if your whole portfolio was tied to just this stock!
Gold fell $14.20 and continues to exhibit weakness as does silver. Luckily I bought to close my January $44 naked puts yesterday on AGQ for a very small profit. Silver also continues to look weak and as such could be set to fall further despite all the reports I read about silver moving higher in the next month or two. If Silver does fall further I will be back Put Selling in AGQ.
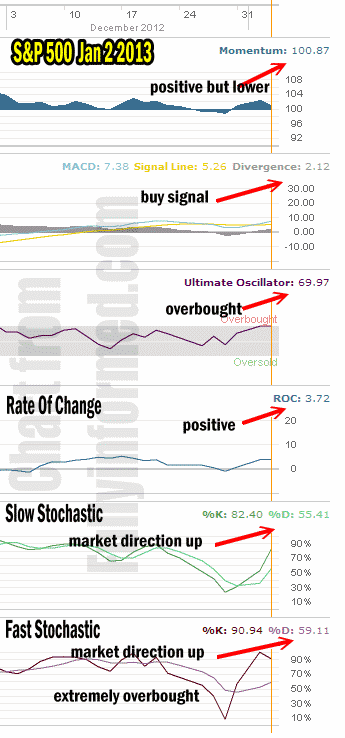
Market Direction Technical Indicators for Jan 3 2013
Let’s look at the market direction technical indicators for January 3 2013 on the S&P 500 to see if we can see if the weakness will last another day or two.

Market Direction Technical Indicators for Jan 3 2013
For Momentum I am using the 10 period. Momentum is still positive but naturally it is lower today reflecting the shift in market direction.
For MACD Histogram I am using the Fast Points set at 13, Slow Points at 26 and Smoothing at 9. MACD (Moving Averages Convergence / Divergence) is still flashing a buy signal and moving higher.
The Ultimate Oscillator settings are Period 1 is 5, Period 2 is 10, Period 3 is 15, Factor 1 is 4, Factor 2 is 2 and Factor 3 is 1. These are not the default settings but are the settings I use with the S&P 500 chart set for 1 to 3 months.
The Ultimate Oscillator is still very overbought.
Rate Of Change is set for a 21 period. Rate Of Change is still positive and is not reflecting any concern on market direction.
For the Slow Stochastic I use the K period of 14 and D period of 3. The Slow Stochastic is now overbought but it is signaling that the market direction remains higher. As the slow stochastic predicts further out than a day or two, we could see weakness tomorrow especially if the jobs numbers do not meet expectations, but overall the market direction should be moving higher shortly.
For the Fast Stochastic I use the K period of 20 and D period of 5. These are not default settings but settings I set for the 1 to 3 month S&P 500 chart when it is set for daily. The Fast Stochastic is extremely overbought but it too is signaling that once the overbought situation erodes a bit, the market direction will be higher.
Market Direction Outlook And Strategy
The market direction outlook he end of the 1st week of January 2013 is for possibly more weakness but like today there is strength in the market which should soon see higher prices. I am looking for a slight continuation of weakness in the market direction but possibly a higher close than today as the overbought condition weakens.
Strategy wise I am still watching my stocks for a chance to do some Put Selling on dips. I did not do any today although a few are setting themselves up so a bit more weakness and I will be doing some additional Put Selling.
Internal Market Direction Links
