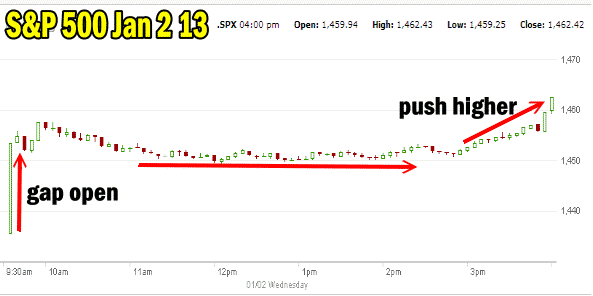
Market direction today saw a big gap open and then sideways until the close. The close saw the market direction move higher. Obviously investors like the end of the fiscal cliff issue with the latest piece of legislation. While the resolution was only a partial one, it seems it was enough for most investors, or at least until the debt ceiling debate begins shortly along with the government tackling spending cuts on all fronts.
The figures from today are staggering as the Dow Index saw the largest market direction rise for the first trading day of any year. The S&P roared ahead marking the 5th year in a row that it has opened higher on the first trading day of a new year. Meanwhile the NASDAQ came barreling ahead and issued a buy signal as it moved up 3.1% for the day.
Volume was impressive and for every stock down, ten stocks rose. Meanwhile the Commerce Department reported U.S. construction spending fell 0.3% in November while the Institute for Supply Management said manufacturing activity expanded in December to 50.7% from 49.5% in November. Treasury prices fell as investors continued to pull money out to put into stocks.
Market Direction Chart Of S&P 500 From Jan 2 2013
Below is today market direction S&P 500 5 minute chart. The huge gap open is obvious as is the push higher into the close. All of this has led the market into overbought territory which will have to be dealt with before the market direction will put much higher.

S&P 500 daily activity for Jan 2 2013
Market Direction Technical Analysis of Jan 2 2013
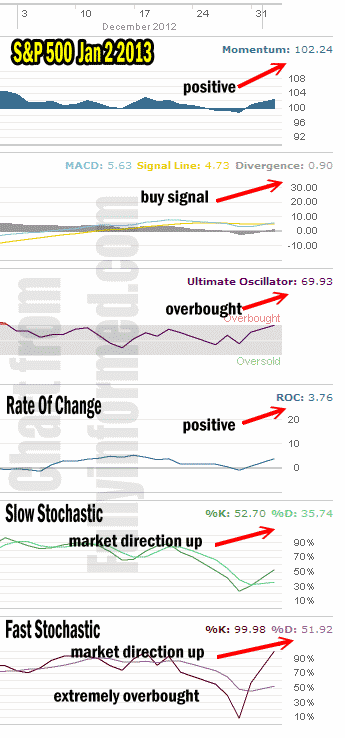
Some strong technical indicators resulted from today’s huge market direction jump and the overbought condition is quite obvious.

S&P 500 Jan 2 2013
For Momentum I am using the 10 period. Momentum up big from yesterday showing the strength among investors from today’s buying.
For MACD Histogram I am using the Fast Points set at 13, Slow Points at 26 and Smoothing at 9. MACD (Moving Averages Convergence / Divergence) is back positive and issued a buy signal for market direction back up.
The Ultimate Oscillator settings are Period 1 is 5, Period 2 is 10, Period 3 is 15, Factor 1 is 4, Factor 2 is 2 and Factor 3 is 1. These are not the default settings but are the settings I use with the S&P 500 chart set for 1 to 3 months.
The Ultimate Oscillator is signaling the market direction is very overbought.
Rate Of Change is set for a 21 period. Rate Of Change is positive and rapidly climbing.
For the Slow Stochastic I use the K period of 14 and D period of 3. The Slow Stochastic is not overbought but climbing signaling market direction still has room to move higher.
For the Fast Stochastic I use the K period of 20 and D period of 5. These are not default settings but settings I set for the 1 to 3 month S&P 500 chart when it is set for daily. The Fast Stochastic is extremely overbought.
The market direction after today’s big jump is naturally overbought. The Fast Stochastic and Ultimate Oscillator are signaling that the market direction should pull back and then continue to move higher.
The Slow Stochastic is showing plenty of room on the upside and once the overbought condition is dealt with, the market direction should be higher. Meanwhile a buy signal was generated today by MACD which, despite possible weakness on Thursday or Friday is confirming the market direction back up.
Market Direction Outlook And Strategy
The market direction outlook for January 3 2013 is for a possible pull back to deal with a strong overbought condition and then the market direction should continue higher. The pull back would be a good point to add to the market direction portfolio but I will leave that to Doug. Meanwhile I will be taking advantage of Put Selling should the market direction pull back as expected before moving higher.
Internal Market Direction Links
