Market Direction today ended up as expected with a sideways movement for most of the day and then a close that was down just slightly. The strength in the market direction is obvious to any investor, or certainly it should be. This stalling action today is simply an extreme overbought condition being worked out through consolidation before the market direction moves higher.
Market Direction Action Jan 28 2013
After the longest winning run in 8 years, the S&P 500 finally turned sideways today and closed down by 2.78 points but still closed at 1500 on the index. Some of the more interesting stories from today including a bounce in Caterpillar Stock, Apple Stock closed up almost $10.00, Research In Motion Stock tumbled 7.75% on nervousness over BB10 and Netflix Stock pulled back 4.39% after quite the run-up last week.
Investors poured $55 billion in new cash into stock mutual funds and exchange-traded funds in January, the biggest monthly inflow on record, research provider TrimTabs Investment Research said.
Everywhere you looked most stocks were seeing profit taking after such a terrific run-up in valuations. Data on Monday pointed to growing economic momentum as companies are seeing better consumer demand. This was evident in USA durable goods orders which jumped 4.6 % in December,that outstripped expectations for a rise of 1.8 %. Pending home sales, though dropped 4.3 percent while analysts were looking for an increase of 0.3 %.
Corporate earnings so far have been stronger than expected as of the 150 companies in the S&P 500 that have reported earnings, 67.3 percent have beaten expectations, which is a higher proportion than over the past four quarters and above the average since 1994. It also shows that estimates had been lowered perhaps too far which allowed so many companies to beat estimates. Meanwhile Yahoo after hours was up 4.4 percent after releasing better than expected earnings.
Market Direction Closings
The S&P 500 closed at 1500.18, down 2.78 points and the Dow closed at 13,881.93, down 14.05 points. The NASDAQ was up 4.59 points to 3154.30.
Market Direction Technical Indicators at the close of Jan 28 2013
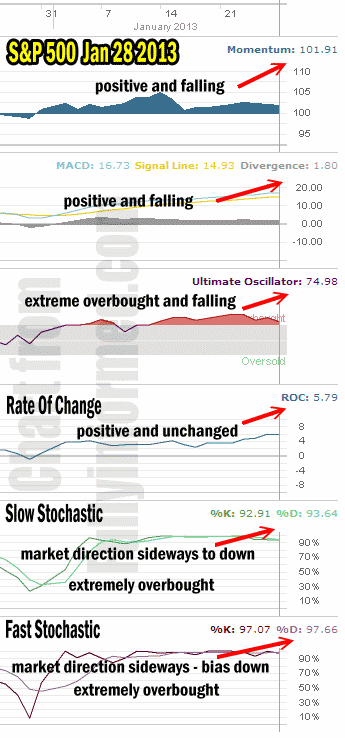
Let’s review the market direction technical indicators at the close of Jan 28 2013 on the S&P 500 to see what they predict for tomorrow Jan 29 2013.

market direction technical indicators Jan 28 2013
For Momentum I am using the 10 period. Momentum is still solidly positive but is falling indicating that tomorrow could see more downside action.
For MACD Histogram I am using the Fast Points set at 13, Slow Points at 26 and Smoothing at 9. MACD (Moving Averages Convergence / Divergence) is still positive and while pulling back a bit today with today’s market direction weakness, there is no sign from MACD that advises that there is any concern on market direction.
The Ultimate Oscillator settings are Period 1 is 5, Period 2 is 10, Period 3 is 15, Factor 1 is 4, Factor 2 is 2 and Factor 3 is 1. These are not the default settings but are the settings I use with the S&P 500 chart set for 1 to 3 months.
The Ultimate Oscillator is still positive and extremely overbought but it is falling as the overbought condition is being worked out. Once the overbought condition disappears look for the S&P 500 to climb higher.
Rate Of Change is set for a 21 period. Rate Of Change is still positive and is basically sideways following today’s action.
For the Slow Stochastic I use the K period of 14 and D period of 3. The Slow Stochastic is overbought to the extreme and is still signaling that market direction is sideways to lower.
For the Fast Stochastic I use the K period of 20 and D period of 5. These are not default settings but settings I set for the 1 to 3 month S&P 500 chart when it is set for daily. The Fast Stochastic is also extremely overbought but it is indicating the market direction still sideways to down.
Market Direction Outlook And Strategy For Jan 29 2013
The market direction outlook for Tuesday January 29 2013 is to see continued weakness in the S&P 500. The consensus among all the technical indicators is that the market direction remains extremely overbought and another day’s rest is certainly in order. The Slow Stochastic and Fast Stochastic are both almost pointing more sideways than down, but neither is pointing higher and that is what is the most important signal.
All the signals at this point following just 1 day of the market not pushing higher, are not bearish, but are indicating that the market direction up cannot resume with conviction until the overbought condition is removed enough for stocks to move higher.
I noted that Doug Harris with his market direction portfolio adjusted his position again today. FullyInformed Members might want to check out his comments for today.
I took advantage of the weakness in stocks today to do Put Selling among Visa Stock, Yum Stock, ABX Stock and have some other stocks on my radar. I believe there is enough strength to take the market direction higher shortly as soon as the present consolidation is completed.
Internal Market Direction Links
Understanding Short-Term Signals
Market Direction Candlestick Daily View (Members only)
Market Direction Portfolio Ongoing Trades (Members only)
