Market Direction on Friday moved higher even though the consensus from the market direction indicators was for the market direction to stall and pull back. I was not looking for much of a pullback, just a point or two in the S&P 500. Instead market direction pushed up and the S&P 500 closed above 1500. The market rally is getting long and now overdone. Investor enthusiasm can often overshoot markets to both the upside. This rally can certainly continue for a few days more but it is now becoming increasingly unlikely that the trend up can continue for much more until the market stalls and rests. The rally in the DOW is the best since 1994 and it can of course continue but in my opinion not without a pause.
Market Direction Closings on Jan 25 2013
The S&P 500 closed at 1502.96 up 8.14 points and the Dow closed at 13,895.98, up 70.65 points. The NASDAQ closed at 3149.71 up 19.33 points.
Market Direction Technical Indicators of Jan 25 2013
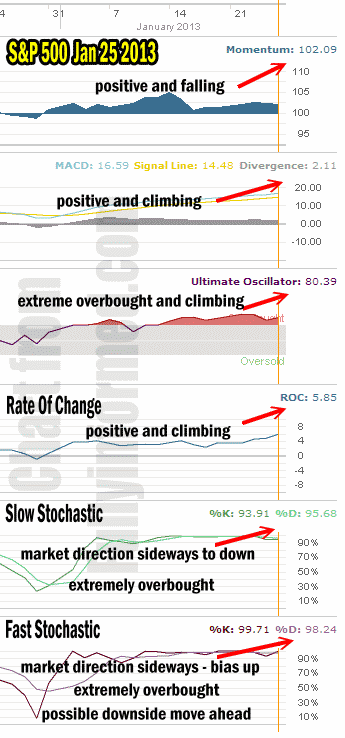
Let’s take a moment now and review the market direction technical indicators at the close of Jan 25 2013 on the S&P 500 to see what they are predicting for Monday Jan 28 2013.

Market Direction Technical Indicators at the close of Jan 25 2011
For Momentum I am using the 10 period. Momentum is still solidly positive but despite the push higher by market direction, Momentum is lower, which again is warning that the move higher does not have strong momentum to continue. Momentum has been one of the better indicators through most this rally in January but it has had trouble the last few days supporting the move above 1500 at this time. Instead it is warning that the move higher might even continue a day or two longer but strength is eroding as the market direction up is tiring.
For MACD Histogram I am using the Fast Points set at 13, Slow Points at 26 and Smoothing at 9. MACD (Moving Averages Convergence / Divergence) is still positive and continues to climb pointing to another higher day on Monday.
The Ultimate Oscillator settings are Period 1 is 5, Period 2 is 10, Period 3 is 15, Factor 1 is 4, Factor 2 is 2 and Factor 3 is 1. These are not the default settings but are the settings I use with the S&P 500 chart set for 1 to 3 months.
The Ultimate Oscillator is still positive is heavily overbought but on Friday it failed to reach a new higher setting. Again this reflects a growing weakness in the rally.
Rate Of Change is set for a 21 period. Rate Of Change is still positive and with Friday’s close, the rate of change is moving higher. This is a signal that market direction will continue to push higher.
For the Slow Stochastic I use the K period of 14 and D period of 3. The Slow Stochastic is overbought to the extreme and is signaling that market direction will be sideways to down. Recalling that the Slow Stochastic looks out beyond a day or two there is no indication of a higher market as the week progresses.
For the Fast Stochastic I use the K period of 20 and D period of 5. These are not default settings but settings I set for the 1 to 3 month S&P 500 chart when it is set for daily. The Fast Stochastic is also extremely overbought but it is indicating the market direction is sideways with a bias up. However a reading this overbought continues to warn of downside action ahead.
Market Direction Outlook And Strategy
The market direction outlook for Monday continues to point to growing weakness in the rally. The market direction indicators are now split at 3 signaling market direction stalling out and 2 signaling continued movement higher and 1, the Fast Stochastic signaling that the market direction has a bias up but is so extremely overbought the trend could change to lower.
The consensus then is split between up and down in market direction. This shows the strength of the rally is now questionable at this point. There is erosion in this strength and signals are cautioning that placing new trades for longer than a day is probably not warranted. Even for Put Selling I am planning on staying on the sidelines and only selling those stocks such as the Barrick Gold trade I wrote about earlier today, that are in significant positions for profit-making even if the market direction stalls here.
I noted that Doug Harris with his market direction portfolio adjusted his position on Friday. FullyInformed Members might want to check out his comments for today.
The market will have to convince me with stronger volume and heavier buying that the market direction can continue to push higher and stay higher. I read a lot of articles on the weekend predicting that 1500 on the S&P is now support. I am not yet convinced of this and the market direction technical indicators are evenly split as to their outlook. The two most accurate technical timing tools in this rally have been momentum and the slow stochastic. Right now both of these are pointing to weakness in the uptrend and change to sideways in the market direction.
Internal Market Direction Links
Understanding Short-Term Signals
Market Direction Candlestick Daily View (Members only)
Market Direction Portfolio Ongoing Trades (Members only)
