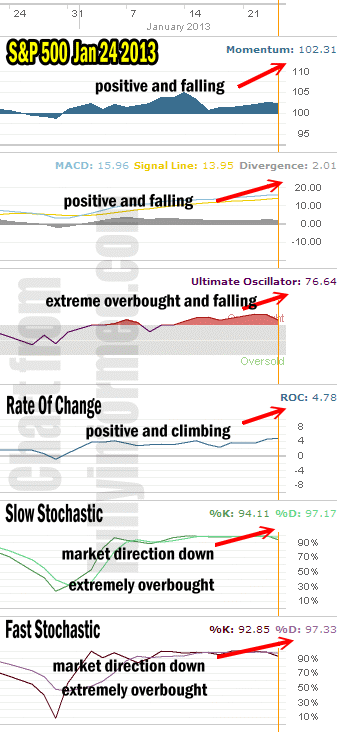
Market Direction today ended up once again pretty much as expected with the S&P 500 ending up just 0.01. The most impressive thing about today’s market action had to be the strength despite the collapse of Apple Stock. The S&P 500 broke through the 1500 level intraday before falling back. The market direction has been heavily overbought for some time and a market breather is certainly in order. That does not mean it will happen. At one point today the Dow was up to 13,879.66 setting another new high.
Even the NASDAQ I thought was fairly strong closing down just 23 points for a loss of three-quarters of a percent. Considering the heavy selling in Apple Stock I think it was surprising to see the NASDAQ market direction close where it did. Things could have been much worse.
Market Direction Closings
The S&P 500 closed at 1494.82 up 0.01 points and the Dow closed at 13,825.33, up 46.00 points. The NASDAQ was dragged lower by Apple Stock to close at 3130.38 down 23.29.
Market Direction Technical Indicators of Jan 24 2013
Let’s take a moment now and review the market direction technical indicators at the close of Jan 24 on the S&P 500 to see where we might end up on Jan 25.

Market Direction Technical Indicators of Jan 24 2013 at the close
For Momentum I am using the 10 period. Momentum is still solidly positive but is falling lower.
For MACD Histogram I am using the Fast Points set at 13, Slow Points at 26 and Smoothing at 9. MACD (Moving Averages Convergence / Divergence) is still positive but also pulling back.
The Ultimate Oscillator settings are Period 1 is 5, Period 2 is 10, Period 3 is 15, Factor 1 is 4, Factor 2 is 2 and Factor 3 is 1. These are not the default settings but are the settings I use with the S&P 500 chart set for 1 to 3 months.
The Ultimate Oscillator is still positive but it too is declining.
Rate Of Change is set for a 21 period. Rate Of Change is still positive and unlike the other indicators it is still climbing. This is an indication that even if the market direction does pull back which seems likely, the overall market direction remains higher, at least at this point.
For the Slow Stochastic I use the K period of 14 and D period of 3. The Slow Stochastic is overbought to the extreme and is now signaling market direction is down.
For the Fast Stochastic I use the K period of 20 and D period of 5. These are not default settings but settings I set for the 1 to 3 month S&P 500 chart when it is set for daily. The Fast Stochastic is also extremely overbought but signaling market direction is down. The Fast Stochastic is confirming the Slow Stochastic signal.
Market Direction Outlook And Strategy
The market direction outlook for Friday Jan 25 is for the markets to pullback. There are no signals indicating any large pullback, but certainly the market direction technical indicators are overwhelmingly indicating the market direction is not going to move higher from here on Friday. I doubt this expected pullback is much of a surprise to most investors. The market direction has been overbought for quite some time and for at least the past two days the technicals have pointed to the market direction stalling out. I am not expecting a severe pullback. I am expecting just a day or two of stalling before the market direction up resumes.
Internal Market Direction Links
Understanding Short-Term Signals
Market Direction Candlestick Daily View (Members only)
Market Direction Portfolio Ongoing Trades (Members only)
