Market Direction on Friday followed the outlook from Thursday. Namely market direction was overbought but the bias was still up. The move by the DOW to continue up another 53.68 points higher and by the S&P 500 to move up 5.04 points higher was more than I expected and shows the strength within the market direction move higher. Despite contrarians and perma-bears, the market direction higher is being supported by investor enthusiasm that the economy is improving and stocks in general are still reasonably valued.
Whether you believe this or not rarely matters. It is the overall market direction that is important and presently the market direction is now higher.
Market Direction Action Jan 18 2013
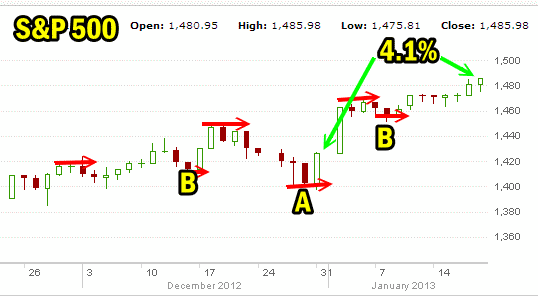
The S&P 500 as you can see in the market direction chart below is now up 4.1% from the start of January. If you read the article on the January effect you are aware that since 1950 when January is up the market direction is up for the year in over 86% of the cases. So while this type of statistic does not really assist us in investing it is interesting that with the VIX Index at the lowest level since 2007 there are a lot of signs that 2013 may end up being better than analysts and financial gurus estimated. In particular have you noticed how wrong the gurus have been since the bear market of 2008-09? Every year overwhelming they have been bearish which is a perfect backdrop for the markets to keep moving higher. The majority still remain bearish which could be good for stocks this year as well. It hard to look out more than a few days with the technical indicators I use which is why I like the long-term moving averages of the 50, 100 and 200 days since they can advise how the market direction is doing longer-term.
In the chart below I have marked three points. You can see there is a pattern of higher highs and higher lows, but it was point A that threw a lot of technical analysts off by establishing a lower low right at the end of December. This has been broken by the two points B which show the return of the higher lows pattern. That is what we need to keep an eye on. If the market direction continues higher and keeps up that pattern of higher lows, then all remains well, but once that breaks then look for prices to pull back and rest.

Market Direction S&P 500 Jan 18 2013
Market Direction Closings
The S&P 500 closed at 1485.98, up 5.04 points or 0.34 percent and the Dow closed at 13,649.70, up 53.68 points or 0.39 percent marking new 5 year highs for both indexes. The NASDAQ was dragged lower by Intel Stock and to a lesser extent Apple Stock to close at 3134.71 down 1.30 points but even the NASDAQ is within shooting distance to its most recent 5 year high of 3,196.93.
Market Direction Technical Indicators of Jan 18 2013
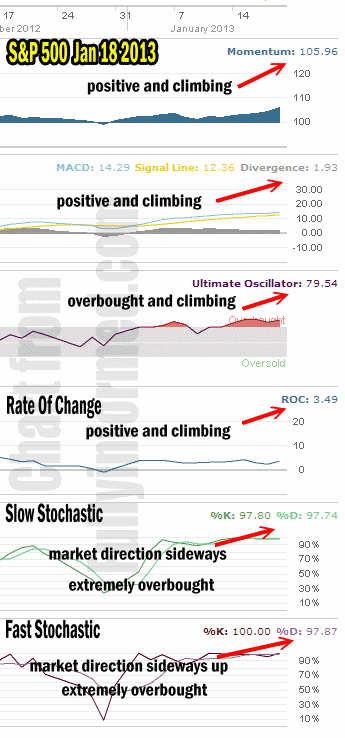
Let’s take a moment now and review the market direction technical indicators at the close of Friday Jan 18 2013 on the S&P 500.

market direction technical indicators January 18 2013
For Momentum I am using the 10 period. Momentum is still solidly positive. Today momentum continued to climb. Momentum is the one market direction technical indicator that has not changed its outlook from the end of December even when earlier in January the market direction had turned sideways. It continues to point to the markets moving higher.
For MACD Histogram I am using the Fast Points set at 13, Slow Points at 26 and Smoothing at 9. MACD (Moving Averages Convergence / Divergence) is still positive and continues to move higher on Friday.
The Ultimate Oscillator settings are Period 1 is 5, Period 2 is 10, Period 3 is 15, Factor 1 is 4, Factor 2 is 2 and Factor 3 is 1. These are not the default settings but are the settings I use with the S&P 500 chart set for 1 to 3 months.
The Ultimate Oscillator is very overbought and continuing to climb back. While not quite as high in its reading as the 80.90 recorded on January 16 today’s reading is still to the extreme and continues to suggest there is a lot of buying going on within stocks.
Rate Of Change is set for a 21 period. Rate Of Change is still positive and the rate of change is moving higher. This is a signal that market direction is still higher.
For the Slow Stochastic I use the K period of 14 and D period of 3. The Slow Stochastic is overbought to the extreme and with both the D period and K period almost with identical readings the Slow Stochastic is indicating that the market direction needs to rest to consolidate gains made. This may not happen at this stage of the rally.
For the Fast Stochastic I use the K period of 20 and D period of 5. These are not default settings but settings I set for the 1 to 3 month S&P 500 chart when it is set for daily. The Fast Stochastic is also extremely overbought but with K period now at 100 which is the highest reading available it is indicating that the markets are seeing strong buying pressure and with a D period reading of 97.87, the bias remains to the upside for market direction starting the fourth week of January.
Market Direction Outlook And Strategy
The market direction outlook for Tuesday January 22 2013 is to see perhaps a bit of pullback of a few points at the open and then for the same pattern to emerge of market direction moving higher throughout the day. The market direction remains strongly to the upside. All the market timing technical indicators are signaling continued buying pressure across all sectors of the stock market.
Dips in favorite stocks remain the best strategy at present for Put Selling but with lower volatility, put premiums are continuing to decline making Put Selling not as profitable. The article Home On The Range looks at the strategy I usually bring out to combat low volatility periods in the stock markets. The other strategy I continue to use is the Shark Option Trading Strategy which works wonderfully well on ETFs like AGQ and stocks like Apple stock although it has not given clear signals on Apple stock for about 3 weeks.
Market direction continues to appear poised to challenge the all-time highs set back in 2007.
Internal Market Direction Links
Understanding Short-Term Signals
Market Direction Candlestick Daily View (Members only)
Market Direction Portfolio Ongoing Trades (Members only)
