Market direction on Friday continued the grinding higher that has been the character of this market all during the week. Two days of weakness at the start of last week was followed by the S&P 500 pushing market direction higher and making new 52 week highs. To cap off the week, the Dow Transport was making new all time highs and the number of stocks in bullish trends above their respective 200 day moving averages was at the highest level in a year. Meanwhile after the markets closed on Friday the news from the mutual fund industry showed that purchases of equity mutual funds reached the highest levels since 2007. I am not sure that last bit of news is all that good considering that most investors seem to always buy the top of markets and then sell out near the bottom.
S&P 500 Market Direction Chart Jan 11 2013
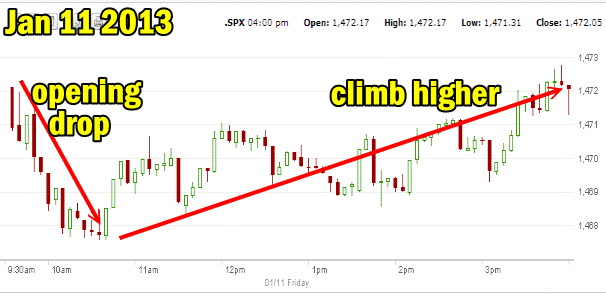
The market direction chart for the day on Jan 11 2013 showed the usual pattern of a sell-off in the morning and then a steady climb into the close. This is a bullish pattern which is not associated with bear markets where normally the opposite occurs. Wednesday and Thursday last week were pretty well carbon copy days while Friday’s push higher in market direction throughout most of the day, did not close the S&P above Thursday’s high, but instead saw the S&P 500 close at 1,472.05, down just 0.03 for the day. The S&P 500 5 minute chart for Friday Jan 11 is below.

Market Direction Jan 11 2012
Market Direction News on Friday
A number of events on Friday could impact stocks this week. The Dow Jones managed to close up 17.21 to 13,488.43 while the NASDAQ closed at 3125.64, up 3.88 for the day. Chinese inflation rose at a faster pace than expected rising 2.5 percent in December over last year. Research In Motion stock was downgraded but continued to climb, rising 12.9 percent on Friday. Other stocks in the news on Friday included Boeing Stock which fell 2.5 percent and Best Buy which jumped 16.4 percent despite reporting a declining cash flow. But investors seemed happy that sales fell less than expected. In my opinion until sales turn around and start rising again, Best Buy is not worth investing in.
Gold fell on Friday closing down $19.60 to $1658.40 an ounce and pushing Barrick Gold Stock down 0.7 percent.
Market Direction Technical Indicators Of Jan 11 2013
To get an idea as to whether Monday Jan 14 will continue to see market direction push higher, let’s look at the market direction technical indicators to see what they are telling investors.

market direction technical analysis for Jan 11 2013
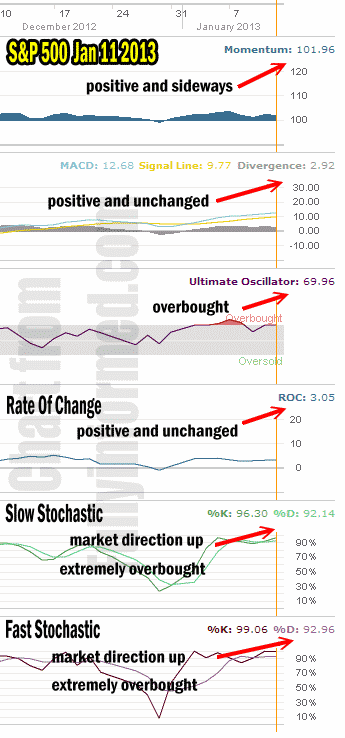
For Momentum I am using the 10 period. Momentum is still solidly positive and is trending sideways.
For MACD Histogram I am using the Fast Points set at 13, Slow Points at 26 and Smoothing at 9. MACD (Moving Averages Convergence / Divergence) is still positive and is almost unchanged from Thursday.
The Ultimate Oscillator settings are Period 1 is 5, Period 2 is 10, Period 3 is 15, Factor 1 is 4, Factor 2 is 2 and Factor 3 is 1. These are not the default settings but are the settings I use with the S&P 500 chart set for 1 to 3 months.
The Ultimate Oscillator is extremely overbought and signaling the market direction needs to rest.
Rate Of Change is set for a 21 period. Rate Of Change is still positive but almost unchanged from Thursday.
For the Slow Stochastic I use the K period of 14 and D period of 3. The Slow Stochastic is extremely overbought but signaling market direction higher.
For the Fast Stochastic I use the K period of 20 and D period of 5. These are not default settings but settings I set for the 1 to 3 month S&P 500 chart when it is set for daily. The Fast Stochastic is extremely overbought as well and at the highest level next to 100% it can reach. Nonetheless it is still signaling market direction up.
The two most important market direction indicators on Friday were momentum and the ultimate oscillator. Let’s see why.
Market Direction Signals Friday January 11
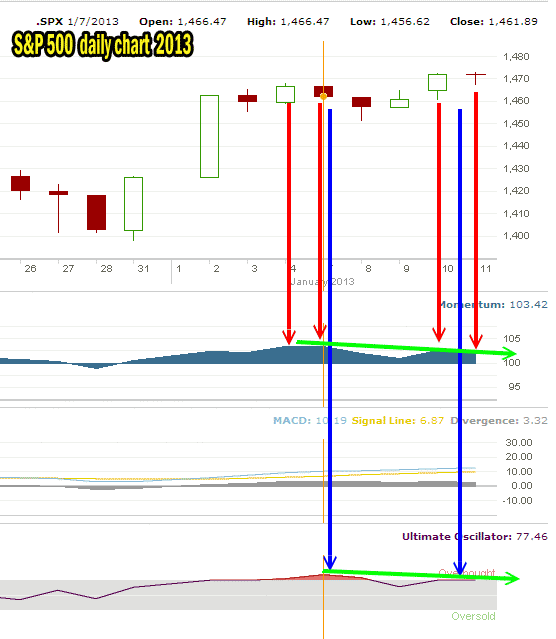
On Friday you could easily see a pattern beginning to develop. if you look at the S&P 500 market direction daily chart below you can see that the market direction push higher back on Jan 4 and Jan 7 had higher readings in both the Ultimate Oscillator and Momentum. But on Thursday and Friday of the past week, the push higher in market direction resulted in momentum actually being lower than on January 4 and 7 and the Ultimate Oscillator is also lower than on January 4 and 7.
These are signals that the market direction move high on Thursday and Friday did not have a lot of strength behind it as investors held back from pushing stocks too much higher. This needs to be watched because if on Monday the market direction continues higher and momentum and the ultimate oscillator continue to fall back, any move higher will fall back within a day or two.

market direction daily time frame
Market Direction Outlook And Strategy
The market direction outlook for the start of the third week of January 2013 then is for the market direction to stall out and pull back slightly and then turn higher once again. The overall market direction is higher, but the short-term move is to try to consolidate further before pushing the market direction higher still. There is a lot of resistance here and the market looks ready to pause. It could move up on Monday but unless momentum and the ultimate oscillator improve the market direction should turn down by mid-week.
For Put Selling I would be tempted to wait to see if we get a small pullback or dip in stocks which would make the VIX Index jump and option premiums should pop a bit because of it, making Put Selling more profitable.
Internal Market Direction Links
