On Friday the market direction surprised me with its strength until I read that James Bullard of the St Louis Fed had advised that there would be no quick end to the Fed’s quantitative easing program. As this had sparked the sell-off in equities, it brought investors back into stocks once again. Added to this was the increase in German business confidence despite the Euro downgrade and the market direction perked right up and closed near the highs for the day.
In my intraday comments I had mentioned how the market had to close above Thursday’s open and on the highs to give enough confidence that the market direction was still up and that Friday was not just a technical bounce. Both happened as the S&P 500 closed at the highs and higher than Thursday’s open. Yet I am not convinced especially with the US Budget issue coming to the forefront over the next week.
Market Direction Closings
The S&P 500 closed at 1515.60, up 13.18 points and the Dow closed at 14000.57, up 119.95 points. The NASDAQ closed at 3161.82 up 30.33. The S&P 500 closed at the highs for the day and the Dow close back at 14000. Both of these should be good signs but as before I continue to believe it is worthwhile to remain cautious. The Dow has attempted to push the market direction above 14000. This could finally be the chance to break through and stay above 14000, but it has had a lot of trouble holding 14000 for two weeks now.
Market Direction Technical Indicators At The Close of Feb 25 2013
Let’s take a moment now and review the market direction technical indicators at today’s close on the S&P 500 and view the next trading day’s outlook.

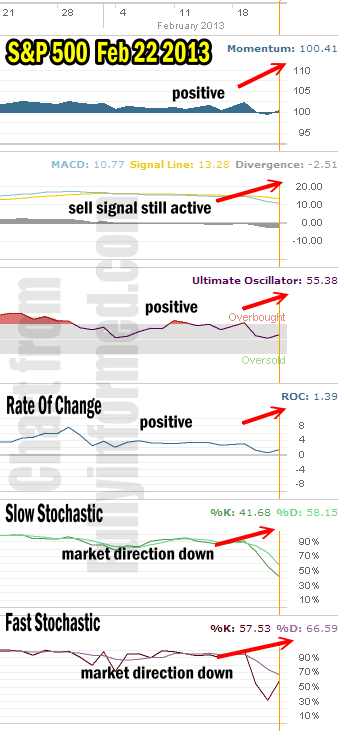
Market Direction Technical Analysis for Feb 22 2013
For Momentum I am using the 10 period. Momentum is turned back positive today following the big rally higher.
For MACD Histogram I am using the Fast Points set at 13, Slow Points at 26 and Smoothing at 9. MACD (Moving Averages Convergence / Divergence) is unchanged from Thursday despite Friday’s push higher. Indeed the sell signal is still confirmed and is stronger on Thursday and Friday than any time since.
The Ultimate Oscillator settings are Period 1 is 5, Period 2 is 10, Period 3 is 15, Factor 1 is 4, Factor 2 is 2 and Factor 3 is 1. These are not the default settings but are the settings I use with the S&P 500 chart set for 1 to 3 months.
The Ultimate Oscillator is back positive a plus for market direction moving higher..
Rate Of Change is set for a 21 period. Rate Of Change is still positive and did not turn negative throughout the weakness of last week.
For the Slow Stochastic I use the K period of 14 and D period of 3. The Slow Stochastic was unconvinced by Friday’s action and it remains indicating that the market direction is still down.
For the Fast Stochastic I use the K period of 20 and D period of 5. These are not default settings but settings I set for the 1 to 3 month S&P 500 chart when it is set for daily. The Fast Stochastic is also indicating that the market direction is down despite Friday’s rally.
Market Direction Outlook And Strategy for Feb 25 2013
The market direction outlook for Monday Feb 25 is mixed. While the closing on the high is bullish, we have seen this scenario before and there has not been follow through. This market direction needs follow through on Monday to prove that the market direction is up.
The market direction technical indicators are evenly split. Three are pointing to market direction as being lower while 3 are pointing to the market direction moving back up. Monday then is a pivotal day for the market direction. Stay cautious but still stay invested. I stay with smaller positions and try to stay out of the money with my naked puts in the hopes of avoiding being caught should the markets pull back. My years of trading tell me that we should move higher from here. It is rare when a market top is put in place by weeks of sideways movement. Almost always a top is set in place when the market moves higher and then turns around and comes right back down. The sideways pattern of the market direction is more in keeping with markets trying to consolidate before moving higher.
That said, it is important to follow the market direction technical indicators and they are evenly split meaning there is a 50% chance the market direction may be lower on Monday.
Internal Market Direction Links
Profiting From Understanding Market Direction (Articles Index)
Understanding Short-Term Signals
Market Direction Candlestick Daily View (Members only)
Market Direction Portfolio Ongoing Trades (Members only)
