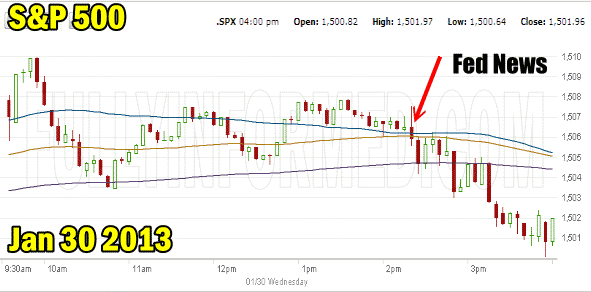
Market Direction today stayed sideways through the GDP contraction news and then turned lower after the Fed’s announcement of continuing historic low-interest rates and the latest round of quantitative easing. Part of the decline must be attributed to the extremely overbought condition of the stock markets as well as profit taking.
Market Direction Action Jan 30 2013
The 5 minute chart of the S&P for Jan 30 2013 is blow. You can see the market direction sideways action until the Fed news was released. I am not sure what investors were looking for but perhaps the GDP contraction coupled with the Fed acknowledging that the economy had slowed was enough for investors to take profits. As well, often these kinds of announcements are used as reasons to sell out of positions.

market direction 5 minute chart Jan 30 2013
Meanwhile though I had explained in an earlier article today that the VIX Index has climbed since Jan 23, which coupled with the overbought condition of the market direction could have been another factor in today’s selling.
Meanwhile though the S&P 500 did close at 1501.96, above 1500, so perhaps 1500 will become support for the S&P. Personally I think it is too early to make that prediction based on the present market direction.
Lots of stock action even though there was not a lot of market direction action. The big news probably was RIM again which today released BlackBerry 10 to less than stellar reviews and a muted response from users. I really believe RIM has had their day. The excitement is gone and has been that way for a long-time now. Let’s hope Apple Stock does not follow them. Meanwhile RIM is changing their name to BlackBerry and I see no point in spending time discussing the merits of a name change. I think it’s too late, too little, not worth it and a waste of money reprinting stationery, signs and more. Instead they need to concentrate on the product and give their end users what they want to keep them. Meanwhile RIM stock fell 12% today so I guess the love affair with BB10 is over before it actually got started.
Facebook Stock (FB Stock) increased revenue 40 percent in the fourth quarter. On other news Amazon Stock (AMZN) continued to rally today but I wouldn’t buy the stock. Qualcomm (QCOM) has excellent earnings growth and their stock was up in after hours trading.
Chesapeake Energy rose 6 percent to $20.11 and my favorite oil refiner, Phillips 66 (PSX) is up to $60.76 moving up again today by 1.47%.
Thomson Reuters reported that of the companies who have released earnings so far 68.8 percent have been above analyst expectations, which is a higher proportion than over the past four quarters and above the average since 1994. To add to the good news private sector employment topped forecasts with the ADP National Employment report showing 192,000 jobs were added in January, higher than the 165,000 that had been expected.
Market Direction Closings
The S&P 500 closed at 1501.96, down 5.88 points and the Dow closed at 13,910.42, down 44 points. The NASDAQ closes at 3142.31 down 11.35.
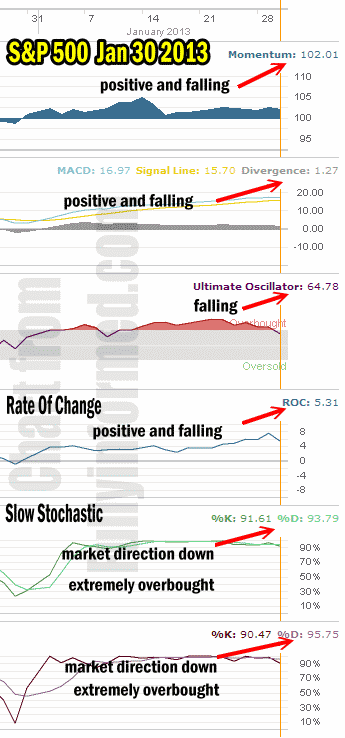
Market Direction Technical Indicators at the close on Jan 30 2013
Let’s take a moment now and review the market direction technical indicators at the close of Jan 30 on the S&P 500 to see what they predict for Thursday Jan 31 2013.

Market Direction Technical Analysis Jan 30 2013
For Momentum I am using the 10 period. Momentum is still positive but back falling after being up just one day this week.
For MACD Histogram I am using the Fast Points set at 13, Slow Points at 26 and Smoothing at 9. MACD (Moving Averages Convergence / Divergence) is still positive but it too is falling.
The Ultimate Oscillator settings are Period 1 is 5, Period 2 is 10, Period 3 is 15, Factor 1 is 4, Factor 2 is 2 and Factor 3 is 1. These are not the default settings but are the settings I use with the S&P 500 chart set for 1 to 3 months.
The Ultimate Oscillator is still positive but it is no longer overbought and it is now falling.
Rate Of Change is set for a 21 period. Rate Of Change is still positive and had a big jump higher yesterday. Today all that gain was given back as the Rate Of Change pulled back considerably from yesterday.
For the Slow Stochastic I use the K period of 14 and D period of 3. The Slow Stochastic is overbought and is signaling that the market direction has changed to down.
For the Fast Stochastic I use the K period of 20 and D period of 5. These are not default settings but settings I set for the 1 to 3 month S&P 500 chart when it is set for daily. The Fast Stochastic is also overbought and is indicating that the market direction is down.
Market Direction Outlook And Strategy
The market direction outlook for January 31 2013 is to see further weakness in the S&P 500. The market direction technical indicators consensus is for the markets to move lower. The market direction may move higher at the start tomorrow, but technically the rally is exhausted at this point. On Monday market direction pulled back to rest and yesterday it tried to pull higher but there is not enough strength in the recovery. Therefore tomorrow market direction should move lower as more investors realize the rally is on standby mode.
I noted that Doug Harris with his market direction portfolio adjusted his position again today. FullyInformed Members might want to check out his comments for today.
The strategy of Put Selling the dips in stocks is now at an end and I will be looking for more downside to boost put option premiums before selling more puts.
The GDP news hit the market at a perfect moment. The Fed was releasing its statement today, the market was very overbought and Friday will bring unemployment numbers. Today’s pullback is nothing to be concerned about but the market direction has softened for now which should push up put option premiums making Put Selling more profitable.
Internal Market Direction Links
Profiting From Understanding Market Direction (Articles Index)
Understanding Short-Term Signals
Market Direction Candlestick Daily View (Members only)
Market Direction Portfolio Ongoing Trades (Members only)
