The market direction outlook for Thursday was for stocks to recover from Wednesday’s tumble. Stocks did this and more. At one point the Dow was up over 300 points. Other events during the day help to push stocks higher as well including quarterly returns from Caterpillar and 3M. There are though still cautionary signals with regards to today’s rally. Let’s start with a look at the intraday market direction action.
SPX Market Direction Intraday for Oct 23 2014
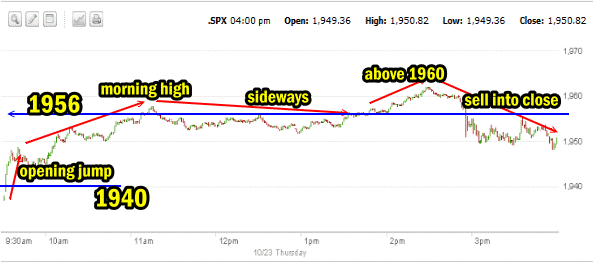
The intraday chart below shows the market direction set for one minute on Thursday. The opening started with an immediate jump back above 1940. By 11:15 the SPX was above the important 1956 level having reached 957.65. From there the market drifted sideways but did not break lower. By 1:30 buyers stepped back in and pushed the SPX to 1961.95 before selling returned to end the day. The SPX fell back below the important 1956 level into the close, ending the day at 1950.82. This marked a gain of 23.71 for a rise of 1.23%.

SPX one minute chart intraday for Oct 23 2014
Advance Declines For Oct 23 2014
The last couple of hours saw heavier volume as sellers started to unload stock once the SPX was above 1956. This brought the day’s volume up to 3.8 billion, 100 million more shares than Wednesday. New highs came in at 101 marking the first triple digit new highs in more than a week. New lows also rose, reaching 32. Of the shares traded up volume was 77% as the day ws strongly bullish despite the mid-afternoon selling.
Market Direction Closings For Oct 23 2014
The S&P closed at 1950.82 up 23.71. The Dow closed at 16,677.90 up 216.58. The NASDAQ closed at 4452.79 up 69.95.
The Russell 2000 IWM ETF closed up $1.93 at $110.88 continuing to point to a recovery for the small cap stocks.
Market Direction Technical Indicators At The Close of Oct 23 2014
Let’s review the market direction technical indicators at the close of Oct 23 2014 on the S&P 500 and view the market direction outlook for Oct 24 2014.

Market Direction Technical Analysis for Oct 23 2014
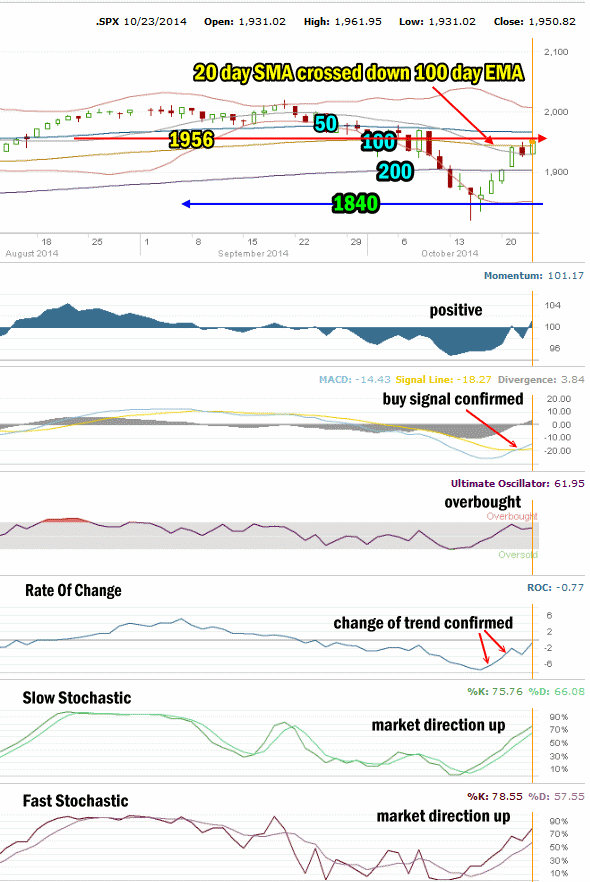
Stock Chart Comments: Stocks recovered today and pushed to end the day above the 100 day EMA for the first time since Sept 29. However stocks closed off their highs for the day. For the first time in days, the 20 day SMA turned sideways today as did the 50 day SMA.
Strong Support Levels are at 1870 and 1840. Both levels are strong enough to delay the market falling. 1930 was given up yesterday. 1956 is also resistance for stocks and today was tested a number of times.
The other two support levels not shown in the chart above are 1775 and 1750. I have explained that these two are critical support for the present bull market. While 1775 is important it is 1750 that is now the bottom line.
A break of 1750 would mark a severe correction of more than 13% from the most recent high. This would be the biggest correction since April 2012. A pull-back of that size would definitely stun investors at this point and it is not something I am anticipating at this time.
Momentum: For Momentum I am using the 10 period. Momentum has been the best indicator, replacing MACD as the most accurate indicator. Momentum has turned positive again today.
MACD Histogram: For MACD Histogram, I am using the Fast Points set at 13, Slow Points at 26 and Smoothing at 9. MACD (Moving Averages Convergence / Divergence) issued a sell signal on Sept 10. MACD is now positive and issued a buy signal on Oct 22 at the close. Today at the close MACD confirmed the buy signal from yesterday.
Ultimate Oscillator: The Ultimate Oscillator settings are: Period 1 is 5, Period 2 is 10, Period 3 is 15, Factor 1 is 4, Factor 2 is 2 and Factor 3 is 1. These are not the default settings but are the settings I use with the S&P 500 chart set for 1 to 3 months. The Ultimate Oscillator is positive and overbought.
Rate of Change: Rate Of Change is set for a 21 period. Today the rate of change is still oversold but is turning up. The change of trend signal remains in place and is continuing to support a change in trend to up.
Slow Stochastic: For the Slow Stochastic I use the K period of 14 and D period of 3. As the Slow Stochastic tries to predict the market direction further out than just one day. The Slow Stochastic is signaling market direction is up.
Fast Stochastic: For the Fast Stochastic I use the K period of 20 and D period of 5. These are not default settings but settings I set for the 1 to 3 month S&P 500 chart when it is set for daily. The Fast Stochastic is still signaling up.
Market Direction Outlook And Strategy for Oct 24 2014
The technical indicators today are reflecting what we might have seen on Wednesday if not for the shootings in Ottawa. The technical indicators are now pointing to further upside for stocks. Both stochastic indicators are strongly bullish and MACD today confirmed the trend to the upside. If the rate of change turns positive on Friday stocks should continue their advance.
There are, as always, cautionary signals. Momentum is only mildly bullish while the Ultimate Oscillator is overbought. This is never the best of combinations. It is always better to see momentum strongly positive when the Ultimate Oscillator is overbought. Still though, after the selling last week, it is nice to see this kind of signal from the technical indicators.
For Friday I am expecting a decent start and then weakness in the morning. In the afternoon however I am expecting stocks to turn positive and close slightly higher. I am anticipating the SPX will challenge the 50 day SMA by Monday but may try to close at it or near it on Friday.
Stay FullyInformed With Email Updates
Market Direction Internal Links
Profiting From Understanding Market Direction (Articles Index)
Understanding Short-Term Signals
Market Direction Portfolio Trades (Members)
