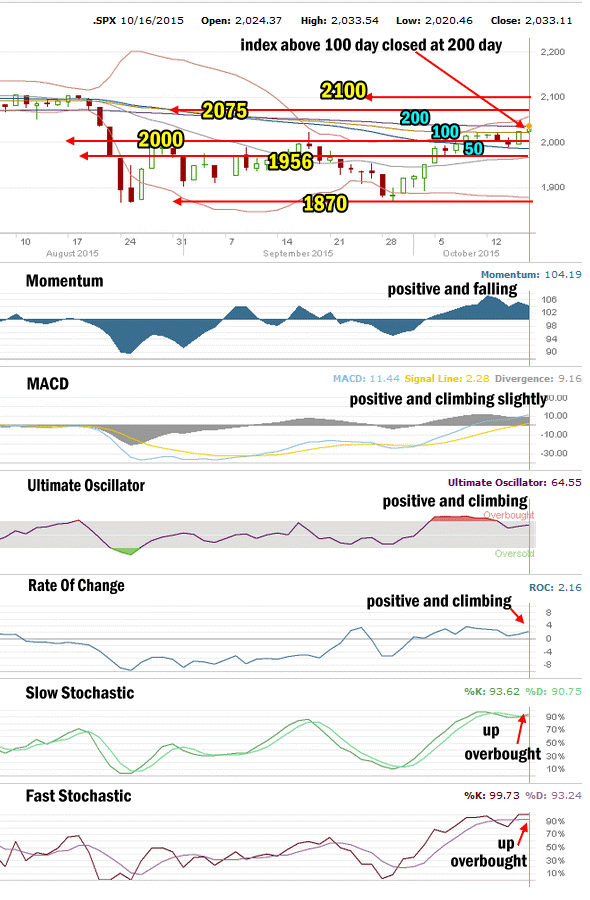
The market direction outlook for Friday was for stocks to continue their advance and push higher above 2020. The morning saw the markets hold above the 2020 level and twice break the 2030 valuation before falling quickly around 1:40 to retest 2020. That sparked an afternoon rally which pushed the SPX to 2033.54 and a close at 2033.11 just off the high.
Market Direction Closings For Oct 16 2015
Markets rallied hard in the late afternoon to close at their highs. The S&P closed at 2033.11 up 9.25 and back above 2020 for the second day. The DOW closed at 17215.97 up 74.22. The NASDAQ closed at 4,886.69 up 16.59.
Advance Decline Numbers for Oct 16 2015
Volume on Friday was slightly lower at 3.57 billion shares. By the close of the day52% of all volume was being traded higher and 47% was moving lower. New lows were just 18 down from Thursday 28 and new highs rose from 35 to 53. These numbers continue to support further advances for stocks.
Market Direction Technical Indicators At The Close of Oct 16 2015
Stock Chart Comments:
The S&P closed today at the highs for the day marked the highest close since just before the August correction tumble. The index closed above the 100 day moving average and at the 200 day moving average. The 20 day simple moving average (SMA) is still turning higher but the 50 day moving average is continuing to trend sideways. Friday was the second day for stocks to close above 2020 since Wednesday’s close.
Support and Resistance Levels:
These are the present support and resistance levels.
2100 was light support. Stocks have been unable to stay above this level and push higher on numerous occasions. It remains resistance.
2075 was light support. Below that was 2050 which was also was light support. Stronger support is at 2000 which had repeatedly held the market up throughout each pullback in January and February but failed under the waves of selling in the last correction. Stocks continue to have trouble holding the 2000 level.
Weak support is at 1970 while stronger support is at 1956 and technically it is more important than 1970 for the market. 1940 is light support. 1920 is now light support. 1900 is more symbolic than anything else.
1870 and 1840 are both levels with strong enough support to delay the market falling and should see a sideways action attempt while investors decide whether to sell or buy. So far 1870 has held the market up better than any of the other support levels aside from 2000 which held the market up for months before the collapse in August.
The other two support levels are 1775 and 1750. I have explained that these two are critical support for the present bull market. While 1775 is important it is 1750 that is the bottom line.
A break of 1750 would mark a severe correction of 384.72 points or 18% from the all-time high of 2134.72. This would be the biggest correction since April 2012. A pull-back of that size would definitely stun investors and bring to question whether the bull market is finished.
Momentum: For momentum I use a 10 period when studying market direction. Momentum is positive but did not rise on Friday which indicates the overbought condition facing stocks.
Members Only Market Direction Outlook for Oct 19 2015
The rest of the Market Direction Outlook for Oct 14 is for members as I lay out some trade ideas I will be considering and discuss in depth the market direction I am expecting for Monday. FullyInformed Members can read the latest Market Direction Outlook and review trade ideas directly through this link. Members can also sign in to the Members’ site here. Non-members can join here or read about the benefits of a membership.
Stay FullyInformed With Email Updates
Market Direction Internal Links
Profiting From Understanding Market Direction (Articles Index)
Understanding Short-Term Signals
Market Direction Portfolio Trades (Members)

