
Stocks took a holiday on Thursday for Thanksgiving and now heading into Friday stocks trade only until 1:00 PM. The biggest news for stocks on Friday will be the plunge in the price of oil and what they will mean for energy stocks and the index.
On Wednesday I had expected a bit of weakness and another lower close. Instead stocks moved sideways and then pushed higher.
SPX Intraday Market Direction for Nov 26 2014
The one minute chart from Wednesday Nov 26 below shows the sideways pattern in stocks that lasted most of the day. Stocks in the morning worked their way higher by about 3 points to 2070 and then trended sideways. No selling emerged and in the last hour investors jumped in and added almost 3 more points. It was primarily an up day for stocks on Wednesday.
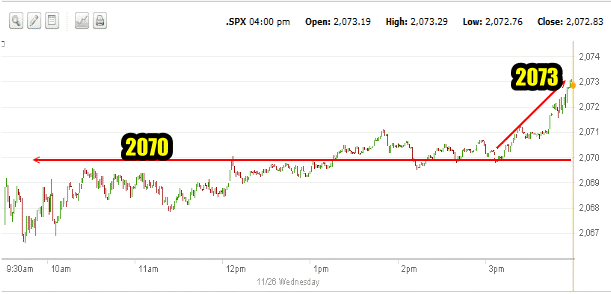
SPX intraday Nov 26 2014
Advance Declines For Nov 26 2014
Volume fell to the just 2.7 billion shares on Wednesday as many investors left early for the start of the Thanksgiving holiday. This partly accounted for the lack of selling. Yet despite the low volume 44% of all shares traded were down while 55% was up. There were 145 new highs and 32 new lows.
Market Direction Closings For Nov 26 2014
The S&P closed at 2072.83 up 5.80. The Dow closed at 17,827.75 up 12.81. The NASDAQ closed at 4787.32 up 29.07.
Market Direction Technical Indicators At The Close of Nov 26 2014
Let’s review the market direction technical indicators at the close of Nov 26 2014 on the S&P 500 and view the market direction outlook for Nov 28 2014.
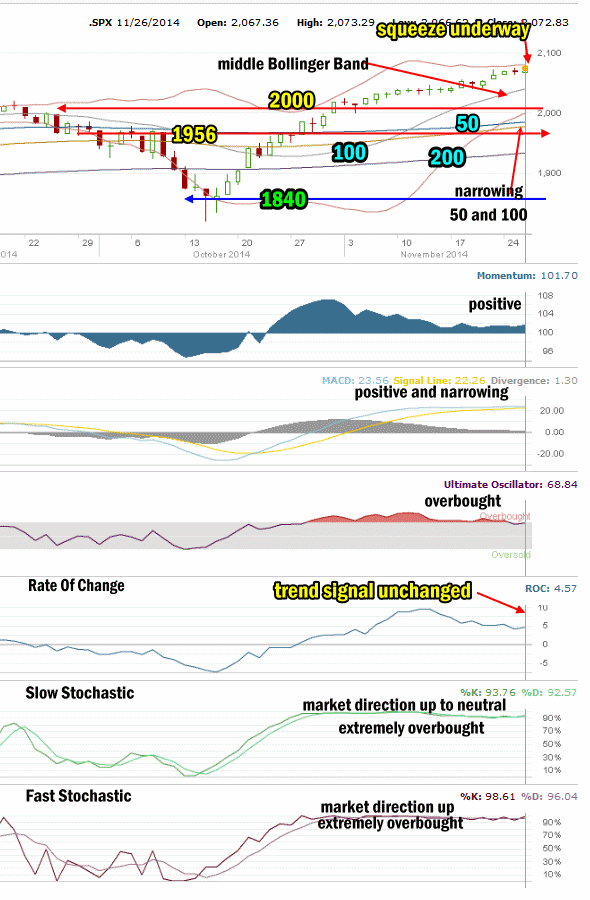
Market Direction Technical Analysis for Nov 26 2014
Stock Chart Comments: The trend higher continues with the candlesticks continuing to press toward the Upper Bollinger Band. The Bollinger Bands Squeeze is still underway and the Lower Bollinger Band has now broken through all the major moving averages (50, 100 and 200) and the 20 day is rising rapidly. However the 100 day is moving higher but not the 50 day. A crossing of the 100 day over the 50 day will push stocks lower so this needs to be watched. There is light support at 2030 on the SPX but very light and any weakness could easily break through.
2000 is the highest level of decent support at present and while not strong, it should have enough strength to hold sellers back for at least a day in the event of an interim pullback. I am not expecting this to happen at this stage of the rally.
Strong Support Levels are at 1870 and 1840. Both levels are strong enough to delay the market falling. 1956 and 1970 are back as support for stocks.
The other two support levels not shown in the chart above are 1775 and 1750. I have explained that these two are critical support for the present bull market. While 1775 is important it is 1750 that is now the bottom line.
A break of 1750 would mark a severe correction of more than 13% from the most recent high. This would be the biggest correction since April 2012. A pull-back of that size would definitely stun investors at this point and it is not something I am anticipating at this time.
Momentum: For Momentum I am using the 10 period. Momentum is still positive and moving sideways.
MACD Histogram: For MACD Histogram, I am using the Fast Points set at 13, Slow Points at 26 and Smoothing at 9. MACD (Moving Averages Convergence / Divergence) issued a buy signal on October 22. MACD is no longer gaining strength and continues to narrow the divergence. It is however positive and that alone supports the outlook for stocks to continue to grind higher. Today though marked an even further narrowing of the divergence.
Ultimate Oscillator: The Ultimate Oscillator settings are: Period 1 is 5, Period 2 is 10, Period 3 is 15, Factor 1 is 4, Factor 2 is 2 and Factor 3 is 1. These are not the default settings but are the settings I use with the S&P 500 chart set for 1 to 3 months. The Ultimate Oscillator is positive and remains extremely overbought.
Rate of Change: Rate Of Change is set for a 21 period. The rate of change is staying positive and is now at 9.44 up from yesterday. The Rate Of Change is back trending sideways which indicates no change of trend is expected.
Slow Stochastic: For the Slow Stochastic I use the K period of 14 and D period of 3. As the Slow Stochastic tries to predict the market direction further out than just one day. The Slow Stochastic is signaling market direction is up to neutral and it is extremely overbought.
Fast Stochastic: For the Fast Stochastic I use the K period of 20 and D period of 5. These are not default settings but settings I set for the 1 to 3 month S&P 500 chart when it is set for daily. The Fast Stochastic is signaling up for stocks and is also extremely overbought.
Market Direction Outlook and Investing Strategy Notes for Nov 28 2014
Stocks are looking like they want to break higher as they enter the final day of November. This is a short day with the exchanges closing at 1:00 PM. However with light volume expected stocks could move a bit on Friday. Oil stocks should move lower but how much impact this will have on the S&P index is tough to call. I am expecting perhaps only 7 or 8 points lower. But the candlestick on Tuesday had pointed to indecision and Wednesday failed to follow that trend.
The two stochastic indicates are of very limited value now as they are so overbought that they are giving out conflicting daily signals. This means momentum and MACD are the better indicators. Momentum is sideways but quite positive while MACD continues to narrow the signal lines which points to weakness.
Friday could see stocks move up slightly again but I am expecting a bit of weakness and believe stocks could end the short session with either not much change or a bit lower on the day. Overall then Friday could be a mixed day with a slight bias lower.
Stay FullyInformed With Email Updates
Market Direction Internal Links
Profiting From Understanding Market Direction (Articles Index)
Understanding Short-Term Signals
Market Direction Portfolio Trades (Members)