
My outlook for Friday was for an overbought market to continue but push higher, even if only slightly. Instead stocks had trouble all day and ended lower by the close. The Fed’s most recent policy statement about a possible December rate hike is being seen as hawkish by more and more analysts. A month before the Fed statement the number of analysts expecting any hike this year had fallen to 10 percent. In the weeks’ leading up to the Fed statement this past week that number rose to 20%. After the Fed’s policy statement that number is now 38%. Utility stocks, bond ETFs and financial stocks have all taken a hit since the Fed’s policy statement.
SPX Intraday Oct 30 2015
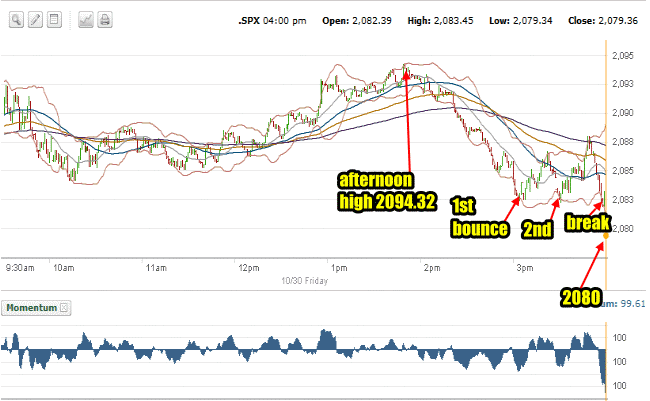
The one minute chart for Friday shows some of the selling pressure the S&P faced. In the morning stocks fell into 10:30 but by 11:00 they had moved above to around the 2088 level. This lasted through into the lunch hour when stocks started to creep higher. Shortly before 2:00 Pm the SPX was up to 2094.32 and looked ready to try to close just below 2100. Instead sellers decided not to wait for 2100 and started selling as this marked the highest level in the S&P for the past week. Selling intensified until the SPX hit 2083. This was followed by a bounce and a short rally which resulted in another drop. A second bounce tried to climb higher but sellers again took over and pushed the SPX through the 2083 level shortly before the close. This brought in headier selling into the close which ended the day just below 2080. The close was the lowest close in 3 trading days.
Looking at momentum you can see how whipsawed the market was all day but after 2:00 momentum turned decidedly bearish. This could set up Monday morning for a short pop at the opena and then more selling into 10:30 or 11:00 AM. While overall the chart is not encouraging for a run at 2100, the market itself is still holding the 2075 support level which is a good signal that the bulls remain in charge presently. As well Monday marks the first of November which is the start of the so-called best 6 months of the year for stocks. Overall I still think there is more upside ahead but certainly last week was not overly encouraging.
SPX Intraday Oct 30 2015
Market Direction Closings For Oct 30 2015
At the end of the day the indexes closed on their lows. The S&P closed at 2,079.36 down 10.05 but still above light support at 2075. The DOW closed at 17,663.54 down 92.26. The NASDAQ closed at 5,053.75 down a modest 20.53.
Advance Decline Numbers
Volume on Friday rose slightly to 4.2 billion shares. Of those shares 51% were traded lower and 45% higher. New lows fell back again to 53 and new highs rose to 59. The new highs and new lows one again showed that the market continues to move more sideways than up or down.
The NASDAQ had 47 new highs and 79 new lows.
Market Direction Technical Indicators At The Close of Oct 30 2015
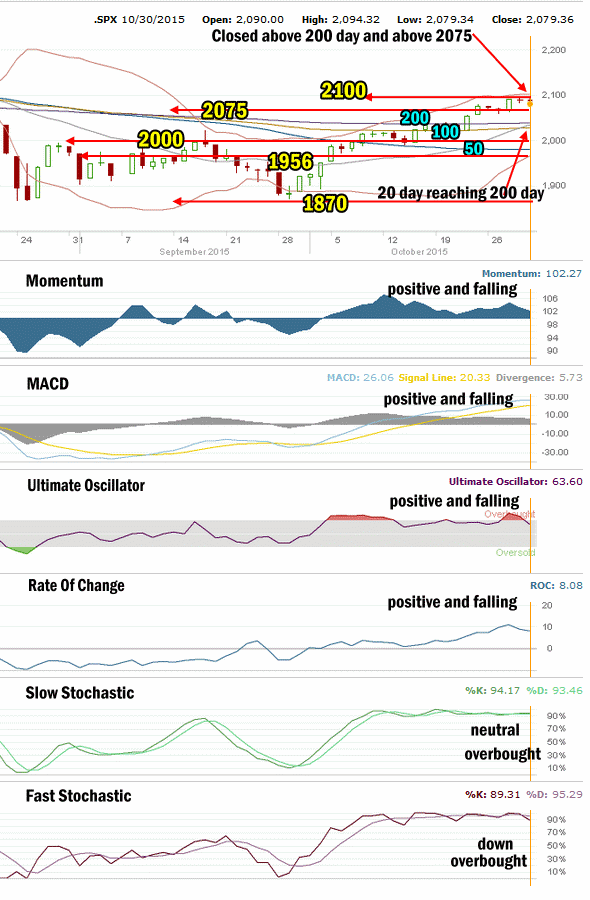
SPX Market Direction Technical Analysis for Oct 30 2015
Stock Chart Comments:
The S&P closed above the 200 day moving average for the seventh time on Friday and above the 2075 support level. The 20 day simple moving average (SMA) has now crossed the 50 day and 100 day moving averages and is pushing higher steadily. It is ready to cross the 200 day moving average as early as Monday.
Once the S&P reached the 2094 level on Friday sellers immediately appeared. Volume picked up and sellers pushed the index down to close at the lows for the day. While certainly not an overly bullish signal, it is not a very strong bearish one either as Friday was also options expiration and the end of the month. However the close was not bullish and that may make the difference starting out on Monday.
Support and Resistance Levels:
These are the present support and resistance levels.
2100 was light support. Stocks have been unable to stay above this level and push higher on numerous occasions. It remains resistance.
2075 is light support. Below that is 2050 which is light support. Stronger support is at 2000 which had repeatedly held the market up throughout each pullback in January and February but failed under the waves of selling in the last correction. Stocks continue to have trouble holding the 2000 level.
Weak support is at 1970 while stronger support is at 1956 and technically it is more important than 1970 for the market. 1940 is light support. 1920 is now light support. 1900 is more symbolic than anything else.
1870 and 1840 are both levels with strong enough support to delay the market falling and should see a sideways action attempt while investors decide whether to sell or buy. So far 1870 has held the market up better than any of the other support levels aside from 2000 which held the market up for months before the collapse in August.
The other two support levels are 1775 and 1750. I have explained that these two are critical support for the present bull market. While 1775 is important it is 1750 that is the bottom line.
A break of 1750 would mark a severe correction of 384.72 points or 18% from the all-time high of 2134.72. This would be the biggest correction since April 2012. A pull-back of that size would definitely stun investors and bring to question whether the bull market is finished.
Momentum: For momentum I use a 10 period when studying market direction. Momentum is positive and fell back again on Friday.
MACD Histogram: For MACD Histogram, I am using the Fast Points set at 13, Slow Points at 26 and Smoothing at 9. MACD (Moving Averages Convergence / Divergence) issued a buy signal on Friday Oct 2. That signal continues to lose strength.
Ultimate Oscillator: The Ultimate Oscillator settings are: Period 1 is 5, Period 2 is 10, Period 3 is 15, Factor 1 is 4, Factor 2 is 2 and Factor 3 is 1. These are not the default settings but are the settings I use with the S&P 500 chart set for 1 to 3 months. The Ultimate Oscillator is positive and falling away from an overbought signal.
Rate of Change: Rate Of Change is set for a 21 period. The rate of change signal is positive and pulled back somewhat on Friday. Still the reading is too high for much of a sustained move higher. There is almost always a pullback of some kind when the signal is this high.
Slow Stochastic: For the Slow Stochastic I use the K period of 14 and D period of 3. The Slow Stochastic tries to predict the market direction further out than just one day. The Slow Stochastic is deeply overbought and is at neutral to start Monday.
Fast Stochastic: For the Fast Stochastic I use the K period of 20 and D period of 5. These are not default settings but settings I set for the 1 to 3 month S&P 500 chart when it is set for daily. The Fast Stochastic is pointing down for stocks and is also very overbought.
Market Direction Outlook for Nov 1 2015
Historically we are entering the best 6 months of the year but we are also facing the possibility of the first interest rate hike since 2008. This time, perhaps it will be different. For the NASDAQ November marks the third best month since 1971 and for the S&P and Dow it is the third best month for gains since 1950. In particular, the week before Thanksgiving stocks have been up 16 of the last 21 years.
That said, Friday was rather bearish into the close. This drop on Friday and Monday being the first trading day of November may set up the market for a pop at the open. That though seems unlikely to hold and I am expecting some selling in the morning. Overall though the outlook is still for stocks to either stay sideways or by the close of the day move higher. There are though signs of trouble on the horizon for Monday which investors should heed.
My outlook was up for both Thursday and Friday and neither day worked in my favor. While I remain bullish I am also aware of signs of weakness. All the technical indicators are giving back strength. The Rate Of Change, MACD and the two stochastic indicators are not bullish which means 4 of the 6 indicators are weak and pointing to further weakness. That means staying cautious in how much capital to commit is a good idea to start off the week. If the S&P can finally break 2100 and hold above it this week, that will be a signal that November will be decent for more profits. Until then, staying cautious and using only small amounts of capital or having some protection has become warranted with the market stalled all of last week. In general the outlook is poor presently which means while the bias is up, caution is definitely back in focus for Monday.
Stay FullyInformed With Email Updates
Market Direction Internal Links
Profiting From Understanding Market Direction (Articles Index)
Understanding Short-Term Signals
Market Direction Portfolio Trades (Members)
Market Direction External Links
IWM ETF Russell 2000 Fund Info
Market Direction SPY ETF 500 Fund Info